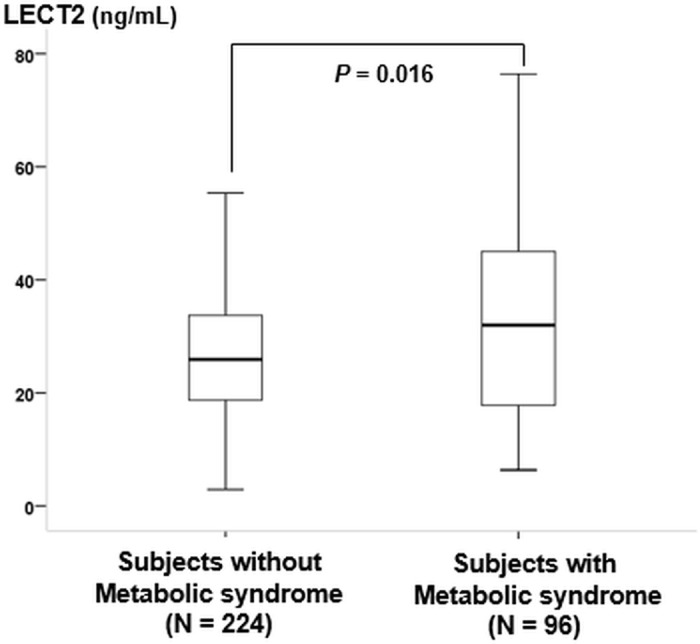
Fig 2. Comparison of circulating leukocyte cell-derived chemotaxin 2 (LECT2) concentrations in the subjects with metabolic syndrome (n = 96) vs. those without metabolic syndrome (n = 224) (32.6 [17.8, 45.0] vs. 27.0 [18.7, 33.7] ng/ml, P = 0.016).

P-values represent the results of a Mann-Whitney test that was conducted to detect differences between the two groups.
