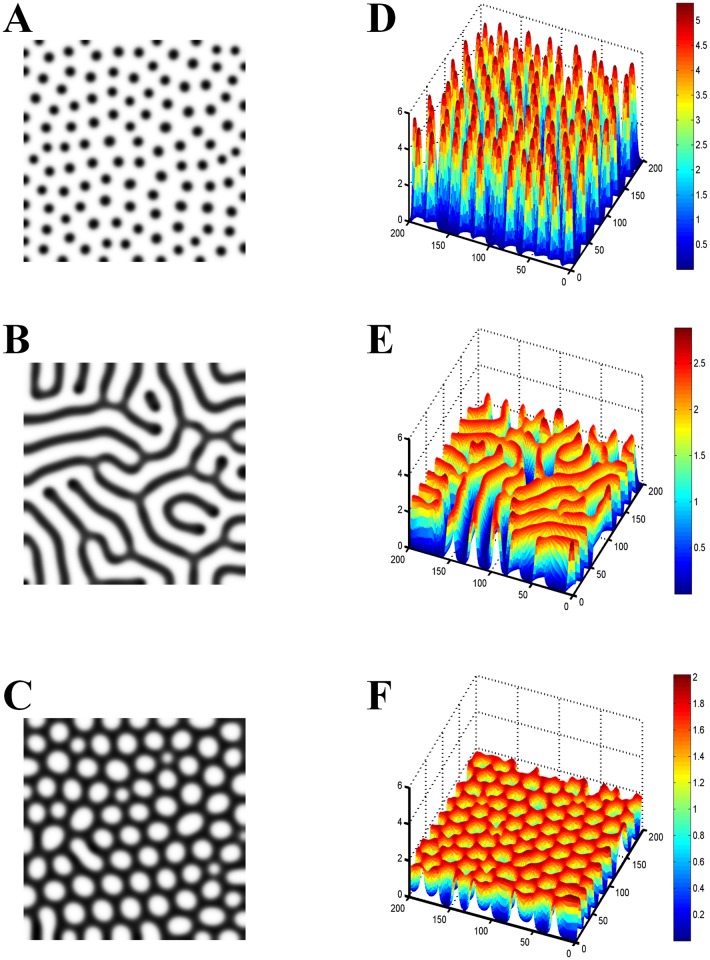
Fig 3. Comparison of the concentration gradients in different Turing patterns.
(A) Spot pattern. (B) Stripe pattern. (C) Hole pattern. (D-F) The Turing patterns shown in 3D form corresponding to patterns A-C. The spot patterns exhibit the highest concentration gradient among the Turing patterns. The Turing patterns were generated by the activator-inhibitor model[4] with a saturation of activator production.

