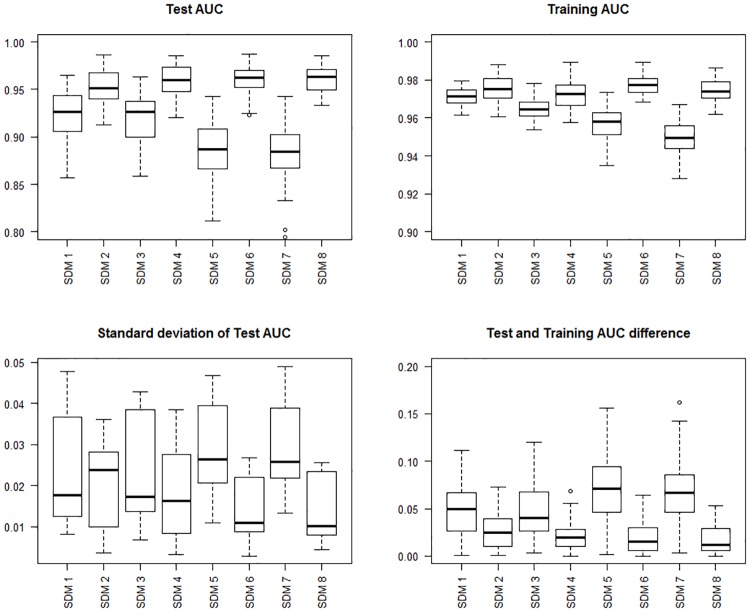
Fig 1. Species Distribution Model (SDMs) evaluation results.
Top left panel shows boxplots of the area under the curve (AUC) for test data. The top right panel shows boxplots of AUC for training data. The bottom left panel shows boxplots of standard deviation of test data. The bottom right panel shows boxplots of test and training AUC differences.

