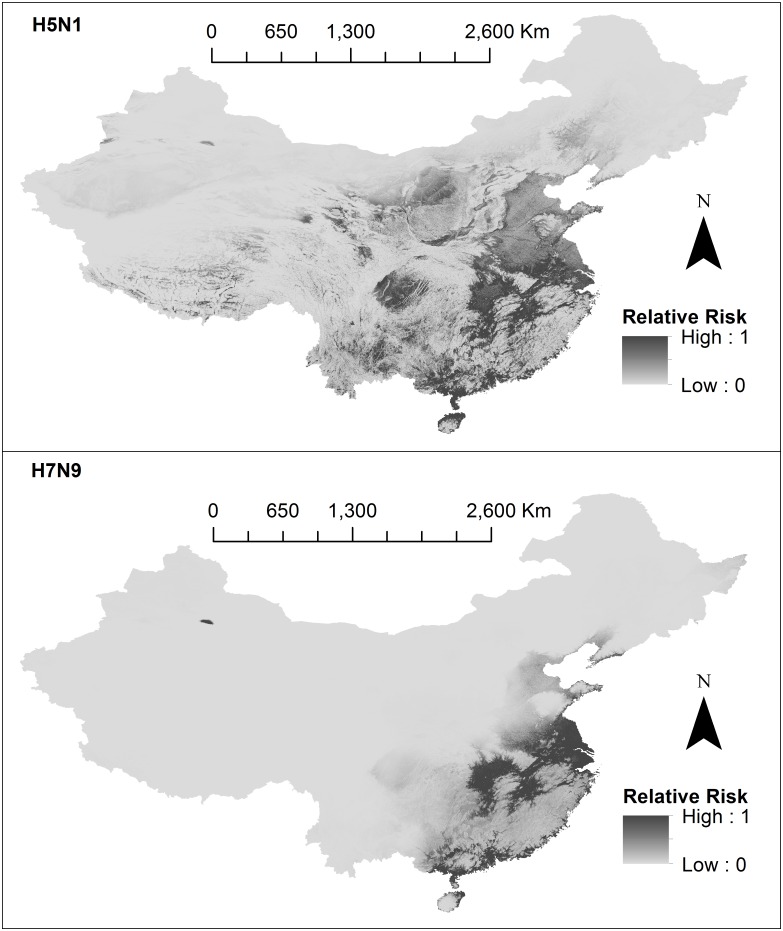
Fig 3. Risk models.
The first panel shows H5N1 and the second panel shows H7N9. Final relative risk values for each cell (approximately 1km2) are represented on a continuous scale of low (light grey) to high (dark grey). Data sources used to develop risk models include: species distribution models (SDMs) 3 and 4 which were produced in this study, domestic chicken population data obtained from Livestock Geo-Wiki (http://www.livestock.geo-wiki.org/), human population data from the LandScan (2014)™ High Resolution global Population Data Set (http://web.ornl.gov/sci/landscan/). Base maps were obtained from the GADM database of Global Administrative Areas (http://www.gadm.org/). Maps were built using ArcMap 10.2.

