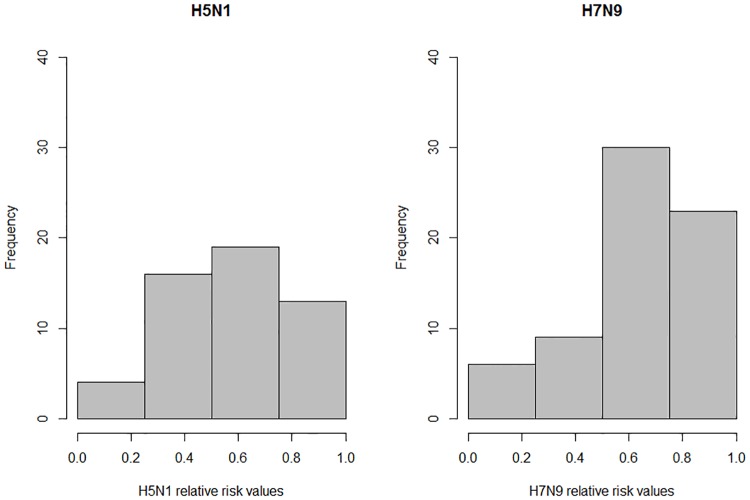
Fig 4. Risk model validation.
Charts show the number of exact case locations which fell into a low risk area (0.0 > Rk ≥ 0.25), low-medium risk area (0.25 > Rk ≥ 0.50), medium-high risk area (0.5 > Rk ≥ 0.75) and high risk area (0.75 > Rk ≥ 1.0). The left chart shows categorisation of H5N1 exact case locations corresponding to the H5N1 risk model. The right chart shows categorisation of H7N9 exact case locations corresponding to the H7N9 risk model.

