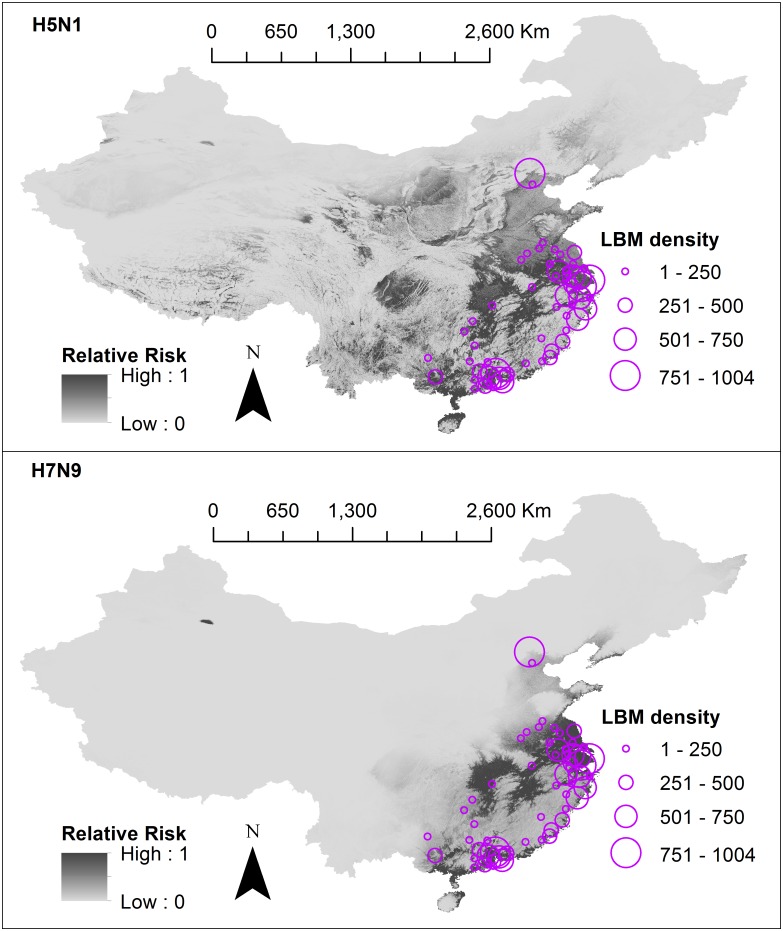
Fig 6. Risk models overlayed with live bird market density.
The first panel shows H5N1 and the second panel shows H7N9. Final relative risk values for each cell (approximately 1km2) are represented on a continuous scale of low (light grey) to high (dark grey). Different sized circles represent the live bird market density per secondary administrative areas (prefectures, municipalities, cities), however data were only available for 43 (of 344) of these areas. Data sources used to develop risk models include: species distribution models (SDMs) 3 and 4 which were produced in this study, domestic chicken population data obtained from Livestock Geo-Wiki (http://www.livestock.geo-wiki.org/), human population data from the LandScan (2014)™ High Resolution global Population Data Set (http://web.ornl.gov/sci/landscan/). Live bird market data were requested from authors of previously published SDMs [27,30]. Base maps of Chinese administrative regions were obtained from the GADM database of Global Administrative Areas (http://www.gadm.org/). Maps were built using ArcMap 10.2.

