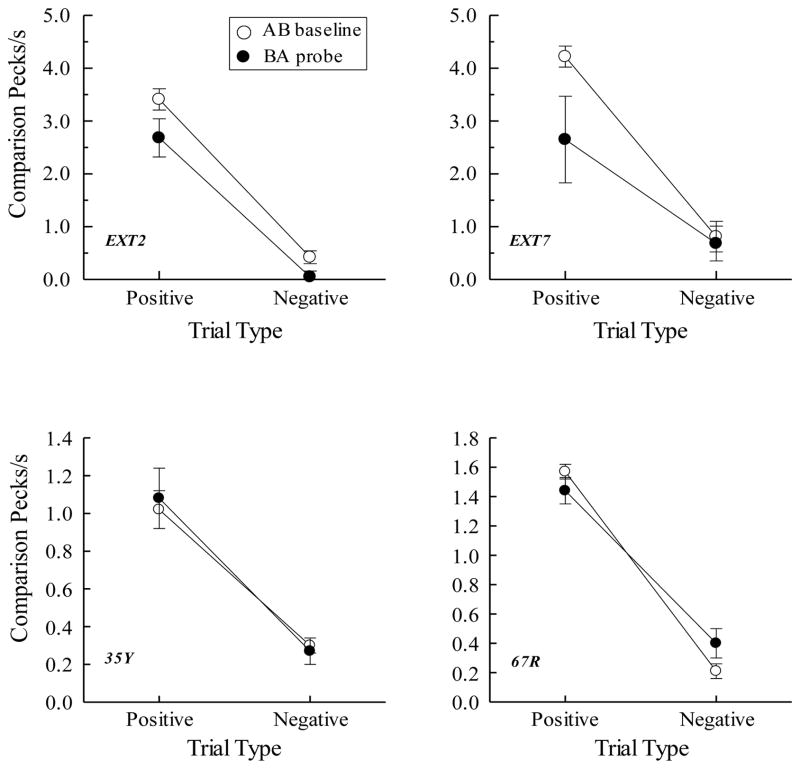
Figure 8.
(Top row). Comparison response rates (in pecks/s) on AB successive matching baseline trials and BA probe trials for two pigeons averaged over their first two symmetry test sessions in Urcuioli (2008, Experiment 3). Positive = reinforced baseline trials and the symmetrical versions of them. Negative = non-reinforced baseline trials and the symmetrical versions of them. (Bottom row). Corresponding response rates for two pigeons averaged over eight symmetry test sessions in Frank and Wasserman (2005, Experiment 1). Adapted with permission from “Associative symmetry in the pigeon”, by A. J. Frank and E. A. Wasserman, Journal of the Experimental Analysis of Behavior, 84, p. 155. ©2005 by the Society for the Experimental Analysis of Behavior.

