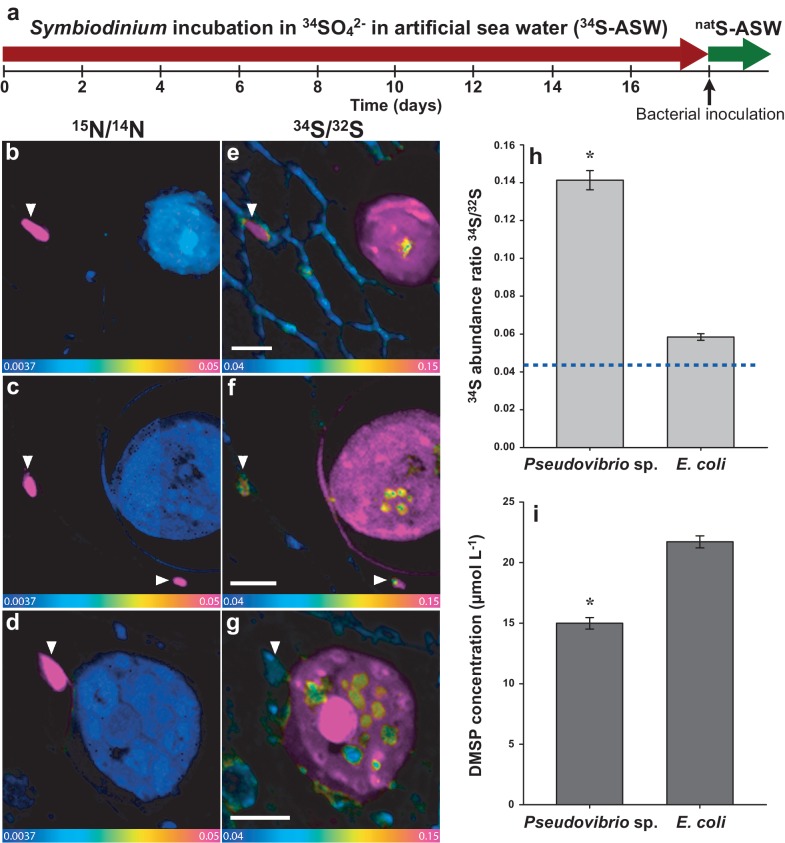
Figure 4. Representative NanoSIMS ion images of Symbiodinium cells exposed to 34S- or natS-artificial seawater (ASW) for 18 days and subsequently inoculated with two different bacterial strains for six hours.
(a) Timeline of the experiment. (b, c and d) 12C15N/12C14N mass images showing the presence of 15N enriched bacterial cells. (e, f and g) 34S/32S ratio image of the same regions. These mass images are shown as HSI images where the colour scale indicates the value of the stable isotope ratios, with natural abundance in blue, changing to pink with increasing 15N or 34S levels. (b, c, e and f) Symbiodinium cultures were inoculated with the DMSP-degrading bacterium Pseudovibrio sp. P12 (treatment 1). (d and g) Symbiodinium cultures were inoculated with Escherichia coli (treatment 2). White arrows indicate bacteria. (h) Isotope ratio of 34S/32S in bacteria, Pseudovibrio cells were significantly more enriched than E. coli (t-Test, n = 60, t = 9.021, *p<0.001, error bars: SE). The dashed blue line represents the natural 34S abundance recorded in the control samples. (i) Total particulate DMSP concentration in Symbiodinium inoculated with Pseudovibrio sp. or E. coli (t-Test, n = 3, t = 9.908, *p<0.001, error bar: SE). Source data available: Figure 4—source data 1. Note: two regions of interest were merged to create Figure 4c due to stage-shifting errors during sequential acquisition of N and S data. Scale bars = 3 µm.
DOI: http://dx.doi.org/10.7554/eLife.23008.014


