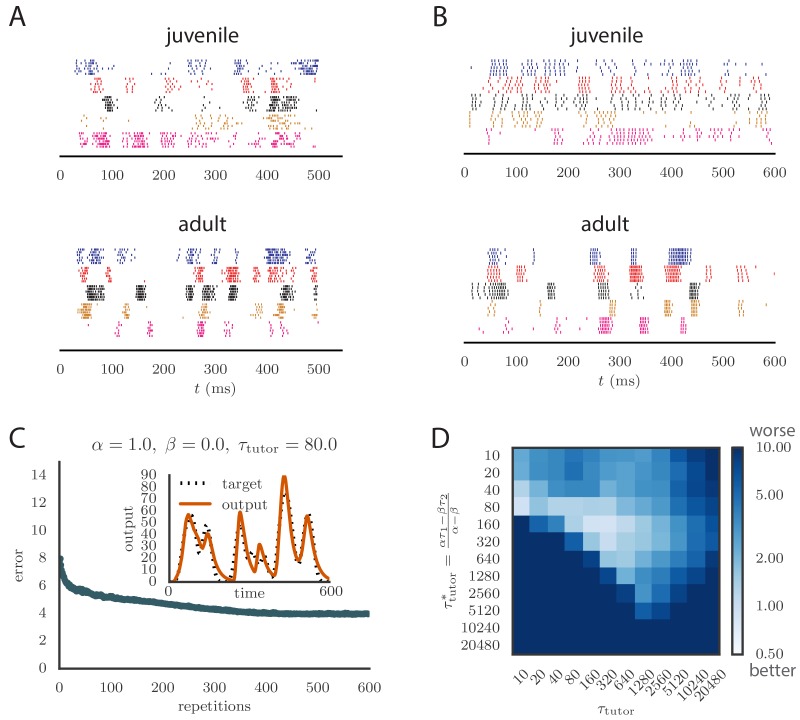
Figure 5. Results from simulations in spiking neural networks.
(A) Spike patterns recorded from zebra finch RA during song production, for a juvenile (top) and an adult (bottom). Each color corresponds to a single neuron, and the song-aligned spikes for six renditions of the song are shown. Adapted from Ölveczky et al. (2011). (B) Spike patterns from model student neurons in our simulations, for the untrained (top) and trained (bottom) models. The training used , , and , and ran for 600 iterations of the song. Each model neuron corresponds to a different output channel of the simulation. In this case, the targets for each channel were chosen to roughly approximate the time course observed in the neural recordings. (C) Progression of reproduction error in the spiking simulation as a function of the number of repetitions for the same conditions as in panel B. The inset shows the accuracy of reproduction in the trained model for one of the output channels. (See online Video 5.) (D) Effects of mismatch between student and tutor on reproduction accuracy in the spiking model. The heatmap shows the final reproduction error of the motor output after 1000 learning cycles in a spiking simulation where a student with parameters , , , and was paired with a tutor with memory timescale . On the axis, and were kept fixed at and , respectively, while and were varied (subject to the constraint ; see section "Learning in a rate-based model"). Different choices of and lead to different optimal timescales according to Equation (4). The diagonal elements correspond to matched tutor and student, . Note that the color scale is logarithmic.

