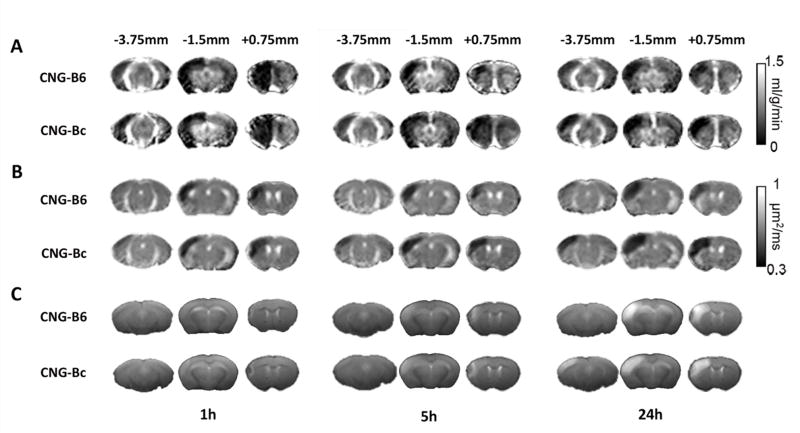
Figure 2. Perfusion and diffusion MRI and T2-weighted images in CNG-B6 and CNG-Bc mice after permanent MCAo (pMCAo).
Group-averaged CBF map (A), ADC map (B), and T2-weighted images (C) at 1, 5 and 24 h after pMCAo. Hypoperfused area was observed in the entire ipsilesional cortex at 1 h in both CNG-B6 and CNG-Bc mice. After 24 h, larger CBF, ADC deficit and final infarct area evident in anterior and posterior cortical regions in CNG-Bc.

