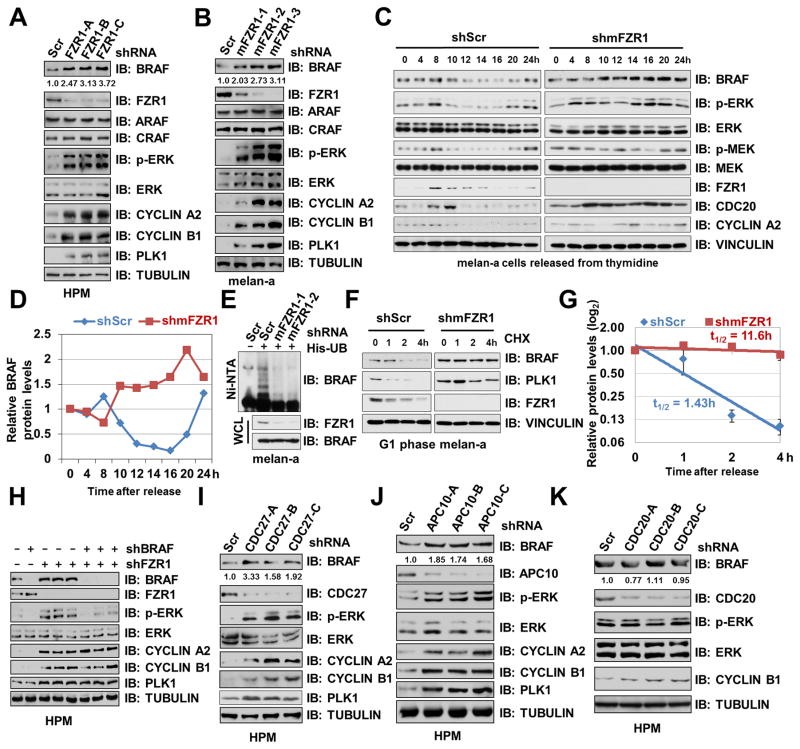
Figure 1. Depletion of FZR1 Leads to BRAF Accumulation and Subsequent Activation of ERK.
(A–B) Depletion of FZR1 led to an elevation of BRAF abundance and its downstream MEK/ERK activities in human primary melanocytes (HPM) and murine melanocytes melan-a. Immunoblot (IB) analysis of HPM (A) or melan-a (B) infected with control (shScr) or indicated shFZR1 lentiviral shRNA constructs. The infected cells were selected with 1 μg/ml puromycin for 72 hours before harvesting. BRAF band intensities were quantified using ImageJ, normalized to corresponding TUBULIN band intensities, and then normalized to shScr.
(C–D) In the absence of FZR1, BRAF protein levels failed to fluctuate across the cell cycle. (C) IB analysis of whole cell lysates (WCL) derived from primary melanocyte-derived melan-a cells synchronized at the G1/S boundary by double-thymidine block then released back into the cell cycle for the indicated periods of time. (D) Quantification of BRAF band intensities. BRAF bands were normalized to VINCULIN, then normalized to the t = 0 time point.
(E) Ubiquitination of endogenous BRAF was attenuated in FZR1-depleted melanocytes. IB analysis of WCL and Ni-NTA (Ni-nitrilotriacetic acid) affinity precipitates derived from melan-a cells infected with the indicated lentiviral shRNA and His-ubiquitin constructs. Cells were pretreated with 10 μM MG132 for 10 hours before harvesting.
(F–G) The half-life of BRAF was extended in FZR1-depleted melanocytes in early G1 phase. melan-a cells were infected with the indicated lentiviral shRNA constructs for 24 hours. Non-infected cells were eliminated by selection with 1 μg/ml puromycin for 48 hours. Cells were then synchronized by double thymidine block (12) and released back into the cell cycle for 14 hours (early G1 phase). 20 μg/ml cycloheximide (CHX) was added to the resulting cells for the indicated time periods before harvesting for IB analysis (F). (G) Quantification of BRAF band intensities was plotted as mean ± SD from three independent experiments, BRAF bands were normalized to VINCULIN, then normalized to the t = 0 time point.
(H) Further depletion of BRAF suppressed the activation of ERK upon FZR1 knockdown. IB analysis of HPMs infected with the indicated lentiviral shRNA constructs. The infected cells were selected with 1 μg/ml puromycin for 72 hours before harvesting.
(I–K) Depletion of APC core subunit CDC27 or APC10, but not CDC20, led to BRAF accumulation and ERK activation. IB analysis of HPMs infected with control (shScr) or the indicated shCDC27 (I), shAPC10 (J) or shCDC20 (K) lentiviral shRNA constructs. The infected cells were selected with 1 μg/ml puromycin for 72 hours before harvesting. BRAF band intensities were quantified using ImageJ, normalized to corresponding TUBULIN band intensities, and then normalized to shScr.

