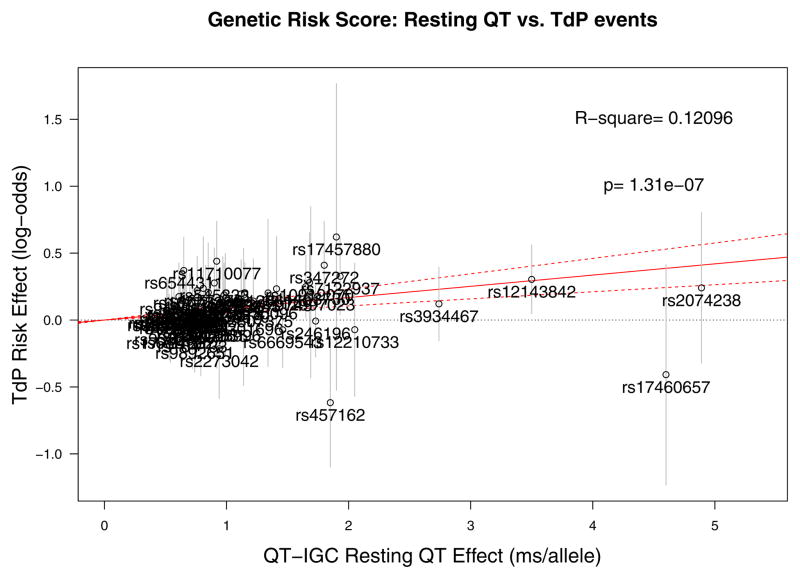
Figure 3. Validation of genotype score in cases of drug-induced torsade de pointes.
Instrumental variable analysis of effect of 60 SNPs associated with resting QTc, using effect estimates from the QT-IGC GWAS (x axis) in milliseconds of predicted QT interval per allele as a predictor of log odds ratio of drug-induced torsade de pointes (y axis). Individual labels represent SNPs used in the analysis, and error bars correspond to the standard error of the log odds ratio of drug-induced torsade de pointes. For example, the QT-raising allele of SNP rs12143842 is associated with a 3.5 ms longer QT interval (Supplementary Table 1) and a ln(OR) of 0.30, corresponding to an OR of 1.35 for torsade de pointes risk (Supplementary Table 6). The overall R-square and p value reflect the effect on torsade de pointes risk of all variants combined in the score.

