Fig. 6.
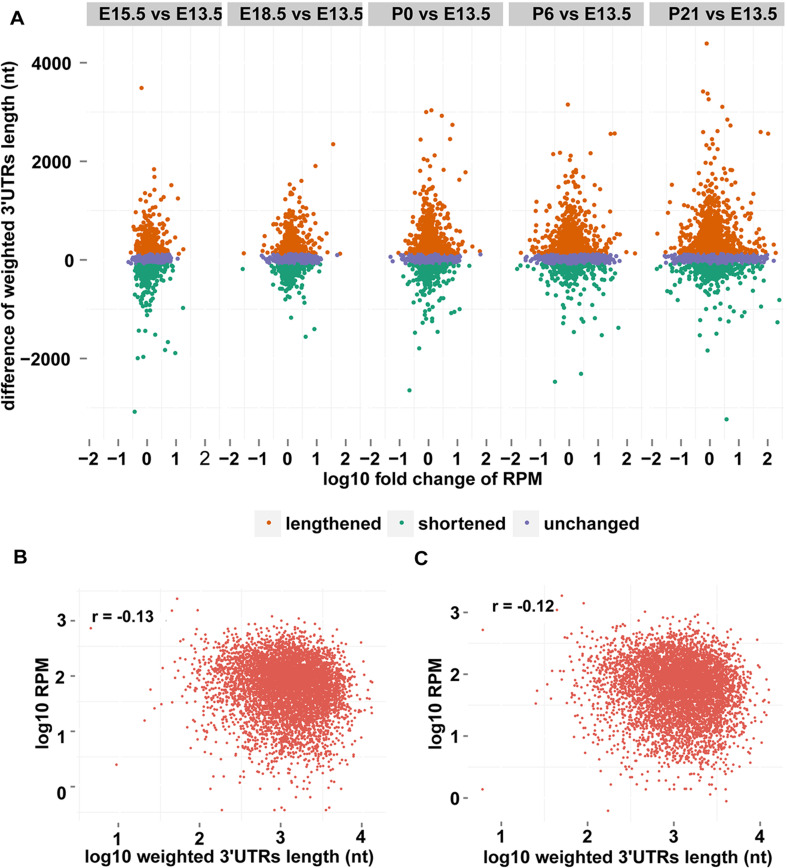
Regulatory role of alternative polyadenylation in gene expression. a Scatter plots of the difference in 3′ UTR length and log10-transformed fold change in transcript abundance when later stages are compared to E13.5. b, c Scatter plots of the 3′UTR length and the expression estimated by the PA-seq tags of pA sites assigned to the same gene at E13.5 (b) and E15.5 (c)

