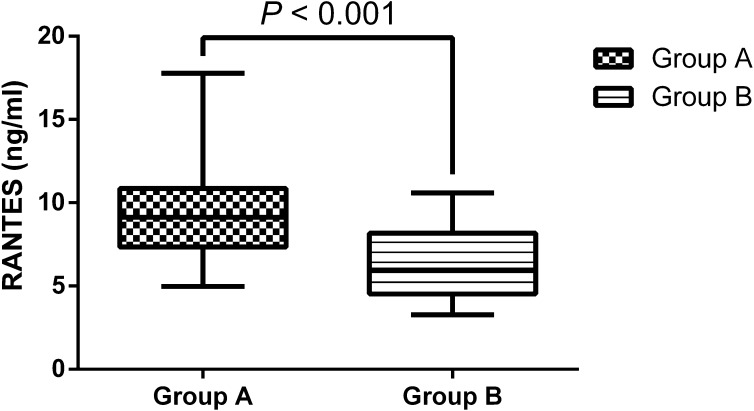
Fig. 1.
Baseline platelet-free plasma regulated upon activation, normal T cells expressed and secreted (RANTES) levels in the study participants. The values are expressed as medians (25th and 75th percentiles). Group A: impaired glucose tolerance patients with hypercholesterolemia (n = 32); Group B: control subjects (n = 32)

