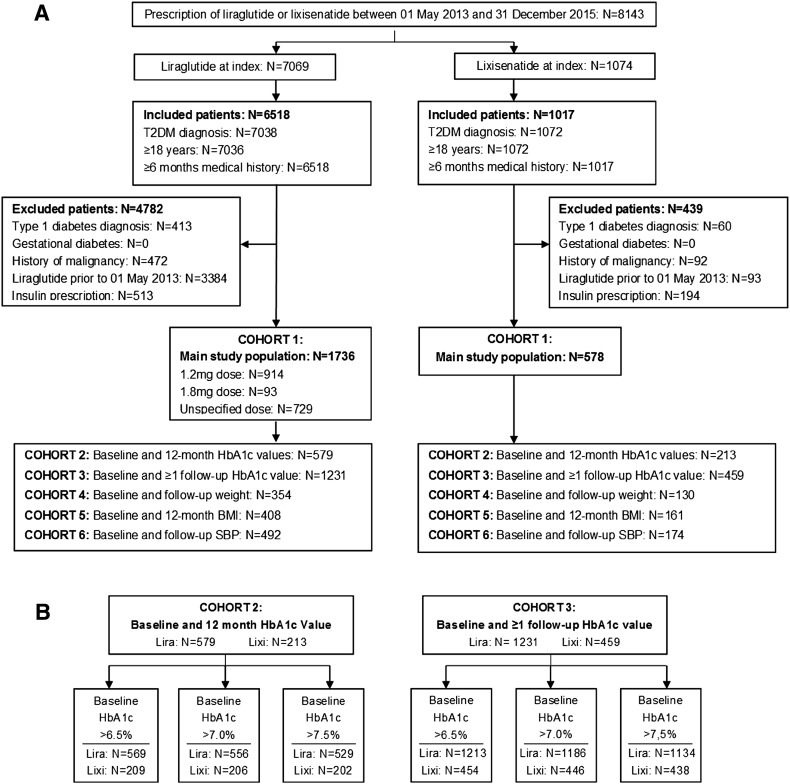
Fig. 1.
a THIN study cohort analysis diagram for main baseline study population (cohort 1) and cohorts for each outcome of interest according to availability of follow-up measurements. b Subdivision of cohorts 2 and 3 into categories according to baseline HbA1c. HbA1c glycated hemoglobin, SBP systolic blood pressure

