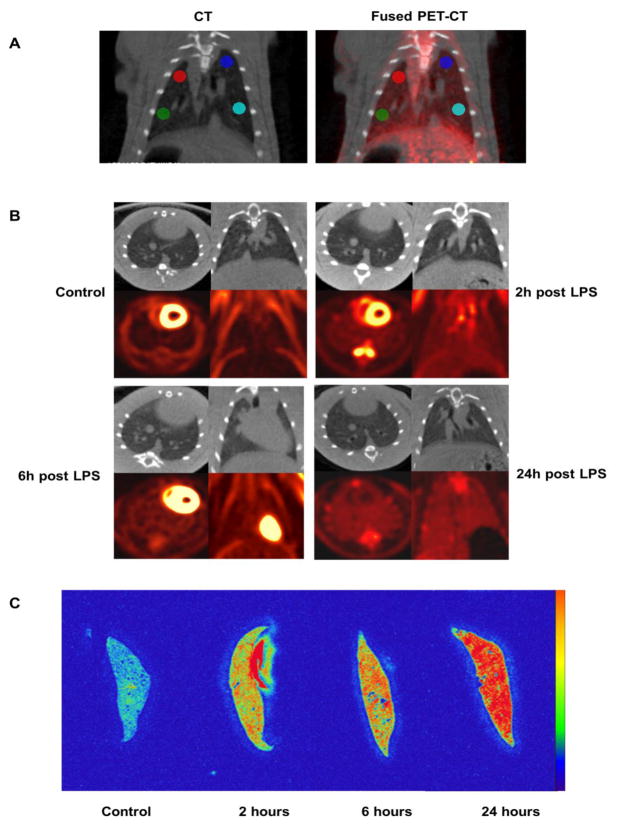
Fig. 1.
Changes in uptake of 18F-FDG and lung attenuation (edema) in controls and 3 separate cohorts of rats receiving an intraperitoneal injection of LPS as a single high dose (10 mg/kg). The cohorts of rats were imaged at 2, 4, and 6 hours post LPS injection. (A) Placement method of regions of interest (example from a rat at 6h post injection of LPS). PET-CT images were first generated using attenuation-corrected PET images. The PET information was visually removed from coronal PET-CT images. A 10 px diameter circular (not volumetric) region of interest was placed in the upper and lower lung zones bilaterally on the CT image, avoiding major vascular structures. The PET information was then added back to the fused images to visually insure that the lower regions of interest had not been placed over the liver. Quantitative information was derived from the CT (HU) and PET images for the same regions. (B) Micro PET/CT images show a rapid and progressive uptake of 18F-FDG by the lungs. However, the development of pulmonary edema as measured by lung attenuation (HU), another hallmark of ALI, was slower to occur and of lower magnitude. Compared to controls, 18F-FDG uptake in the lungs of LPS rats was 1.70-fold greater at 2h (SE 0.38, p < .002), increasing to 2.74-fold by 24h (SE 0.30, p < 0.002). There was no change in lung attenuation of LPS rats at 2h and 6h but a small (mean 10%) but statistically significant (p = 0.043) increase in lung attenuation at 24h, compared to controls. (C). Representative ex-vivo digital phosphor images of lungs in control animals and those at 2, 6 and 24h following LPS administration, showing progressive uptake of 18F-FDG.

