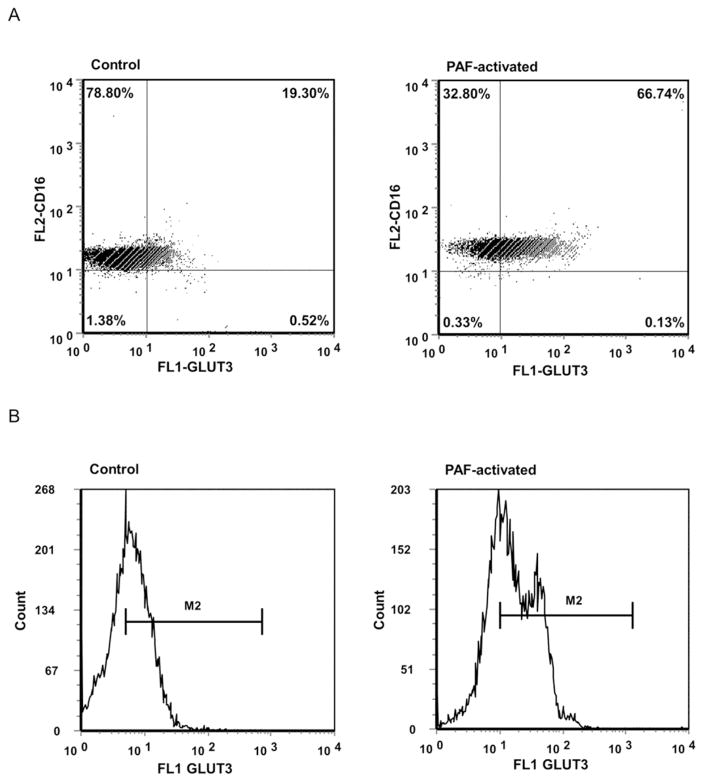
Fig. 6.
Total cellular expression of GLUT3 protein expression by PAF-activated and control human donor neutrophils: flow cytometry. Shown are dot blot (6A) and histograms (6B) profiles of the cells. The percent of neutrophils immunostaining strongly for both GLUT3 and CD16 increased 2.83-fold with PAF activation, a statistically significant difference (p < 0.001). The mean fluorescent intensity per cell also increased 2.51 fold with activation (p < 0.001).

