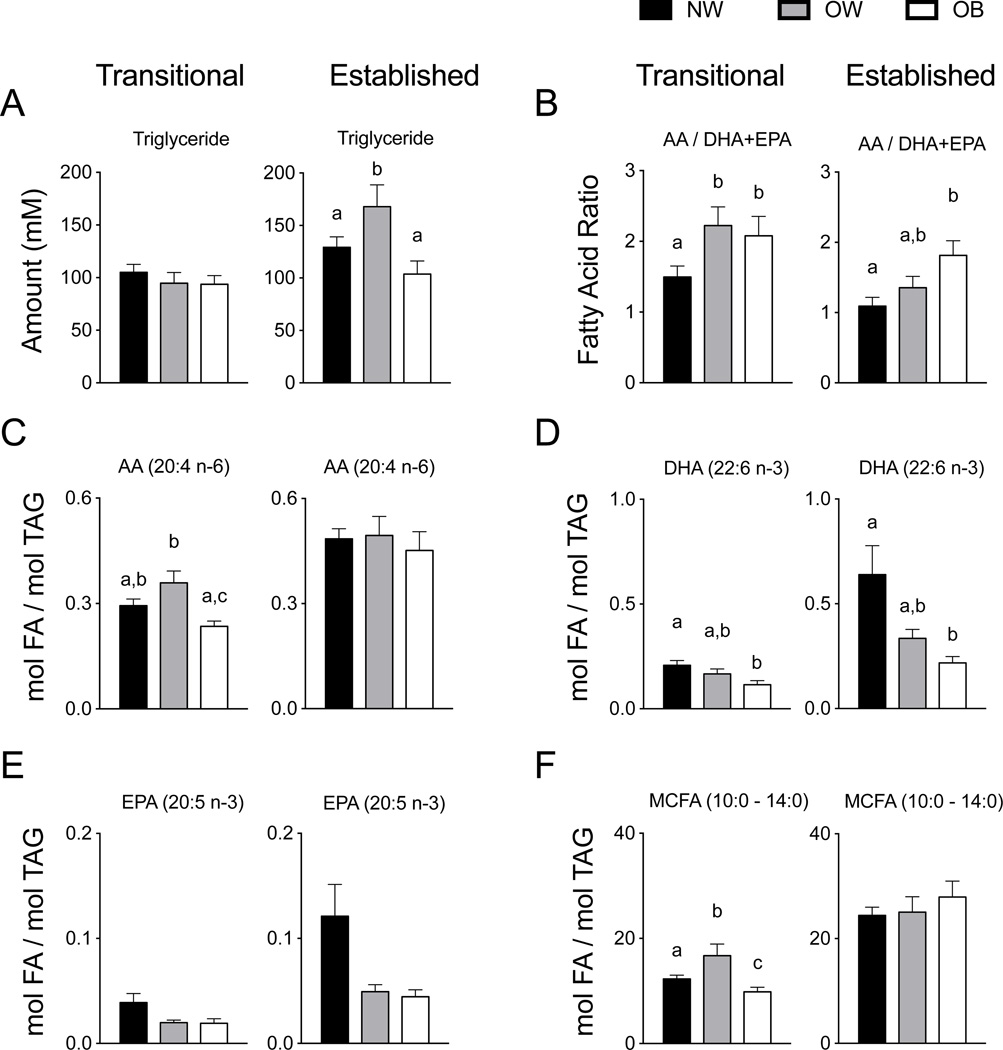
Figure 1. Triglyceride and fatty acid composition of transitional and established human milk.
(A) In transitional milk TAG was not different by maternal prepregnancy BMI group, but in established HM the OW group had significantly greater TAG than did the NW and OB groups (P = 0.048 and 0.01). (B) The ratio of AA/DHA+EPA was significantly greater in OW and OB groups compared to NW (P = 0.03 and 0.04) in transitional HM, and in established HM the AA/DHA+EPA ratio in the OB group 41% greater than the NW group (P = 0.02). (C) The absolute amount of AA (20:4 n-6) present in transitional HM was 30–33% greater in the OW group in the NW and OB groups (P ≤ 0.01), but unchanged among groups in established HM. (D). The absolute DHA amount was decreased by 43% in the OB group relative to the NW group in transitional HM (P = 0.008), and in established HM the DHA amount was 65% less than in the NW group (P = 0.005). (E) EPA tended to be lower in the OW and OB groups in both transitional and established HM. (F) The MCFA in transitional HM was 36% greater in the OW group but 26% lower than the NW group (P = 0.035 and 0.005, respectively). MCFA, medium chain fatty acids; TAG, triglyceride; NW, normal weight n = 26; OW, overweight n = 12; OB, obese n = 10.

