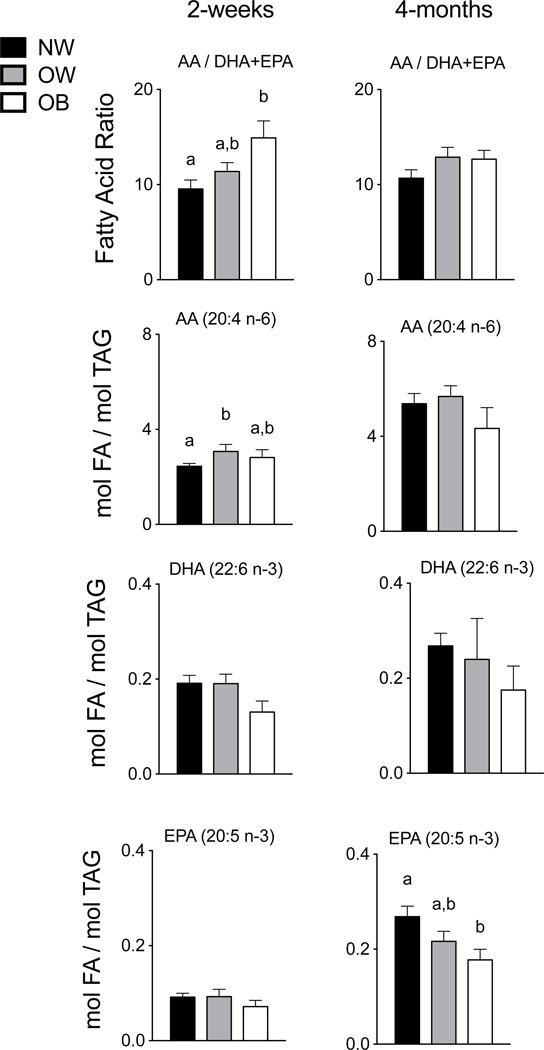
Figure 2. Maternal red blood cell membrane fatty acids at 2-weeks and 4-months postpartum.
At 2-weeks postpartum, the AA/DHA+EPA ratio observed in maternal RBCs of the OB group was 37% greater than in the NW group (P = 0.007), and the absolute amount of AA was 21% more in the OW group compared to the NW group (P = 0.031). The absolute amounts of DHA and EPA in the maternal RBC at 2-weeks postpartum were not significantly among maternal BMI groups. At 4-months postpartum, only the EPA amount was decreased in the OB group relative to the NW group (P = 0.04). NW, normal weight n = 16; OW, overweight n = 10; OB, obese n = 6.

