
Figure 2.
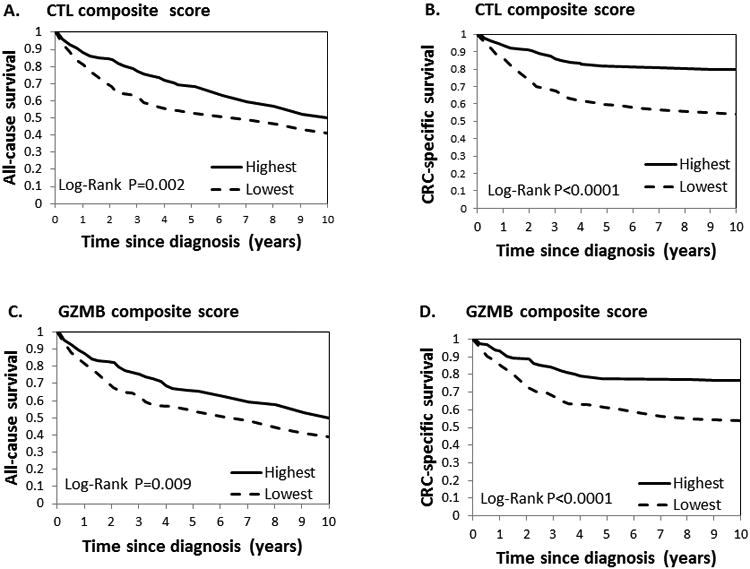
Kaplan–Meier survival curves for the tumor composite scores for CTL and GZMB. (a) CTL score and all-cause survival; (b) CTL score and CRC-specific survival; (c) GZMB score and all-cause survival; (d) GZMB score and CRC-specific survival. For ease of presentation, we dichotomized the scores below and above median (median scores were 5 and 2.3 for CTL and GZMB score, respectively).