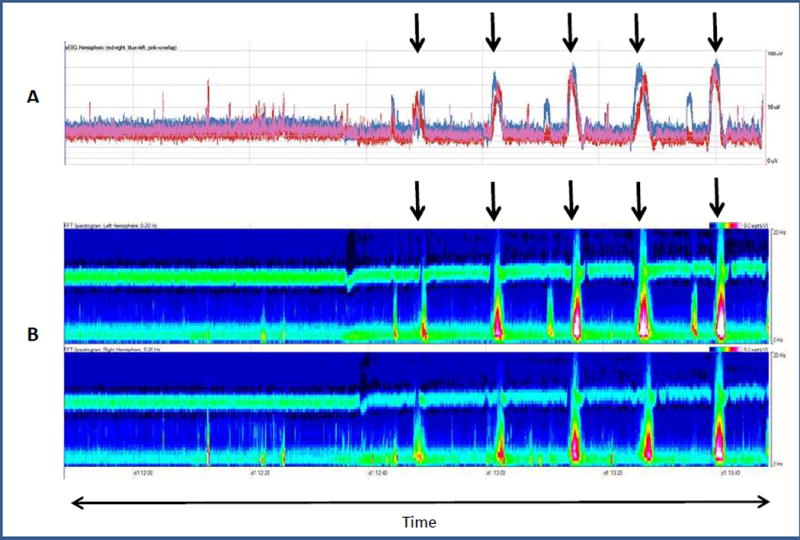
Fig. 1.

(A) Amplitude-integrated EEG (aEEG) and (B) Color Density Spectral Array (CDSA) image (B) for two hours.
(A): aEEG: The red tracing represents the right hemisphere, the blue tracing represents the left hemisphere, and the pink tracing represents both hemispheres. The y-axis represents amplitude (0–100uV). The arrows correspond to seizures. Seizures start with a sharp ramp-up in amplitude tracing (upper and lower margins) and are followed by a rapid decline in amplitude tracing.
(B): CDSA: The top panel displays the left hemisphere and the lower panel displays the right hemisphere. The y-axis represents frequency (0–20 Hz). Power (amplitude2/Hz) is displayed as color. Red and white represent high power, green is moderate power and blue represents low power. The arrows correspond to seizures. Background is low power (blue) in all frequencies. Seizures start with an increase in power in the low frequency range (green) followed by an increase in power in both high and low frequencies (red and white). After the seizure, the power decreases back to baseline.
