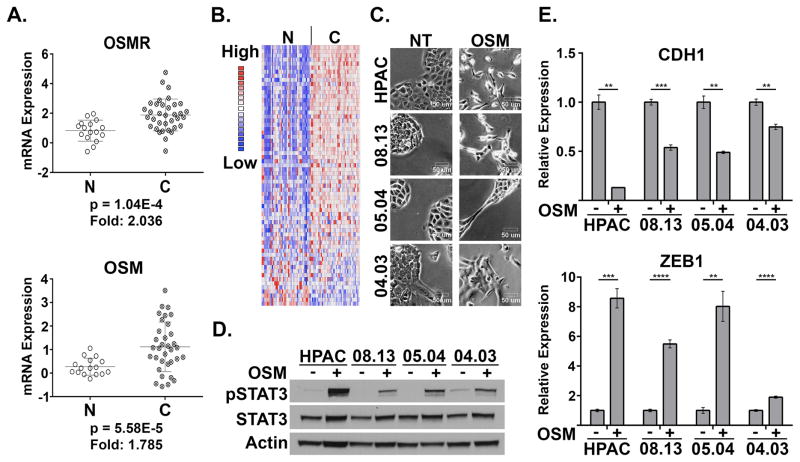
Figure 1. Elevated OSM and OSMR in PDAC drive EMT.
(A) Oncomine data of whole tumor tissue vs. normal pancreas tissue examining OSM and OSMR mRNA levels in PDAC and normal pancreas (60). (B) Expression of a STAT3 gene expression signature (generated by filtering Pancreatic Cancer vs. Normal analysis; then applying filter “genes differentially expressed in melanoma cells in response to STAT3 expression”) in PDAC and normal pancreas. (C–E) A panel of PDAC cells lines were treated with recombinant OSM for one week and analyzed for morphological changes using bright-field microscopy (D; images shown at 200X). STAT3 phosphorylation (Tyr 705), total STAT3, and Actin were assessed using Western blot analysis (D), and E-Cadherin (CDH1) and ZEB1 were assessed using qRT-PCR (E).

