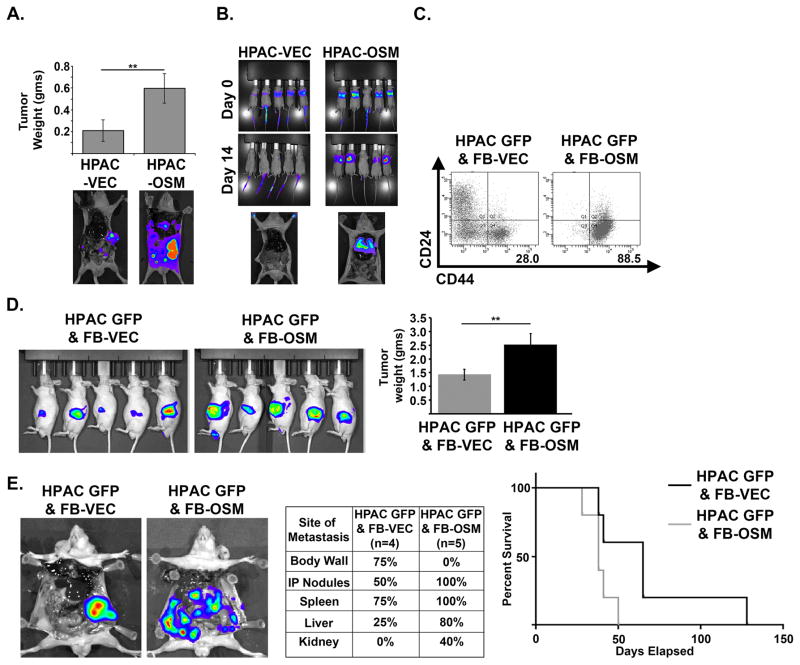
Figure 4. OSM increases tumor burden and metastases in vivo.
(A) HPAC-VEC and HPAC-OSM cells were injected orthotopically into the pancreas of athymic, nude mice. Tumor weight and representative BLI images at the end of the experiment are shown (23 days post injection). A two tailed Student’s t-test was used to determine significance; ** = p ≤ 0.01. (B) HPAC-VEC and HPAC-OSM cells were injected via the tail vein in athymic, nude mice. BLI images showing lung colonization at 14 days post injection are shown. (C–E) HPAC-GFP were co-cultured with control fibroblasts (FB-VEC) or fibroblasts expressing OSM (FB-OSM). Following one week of co-culture, CD24 and CD44 surface expression on HPAC-GFP was assessed via flow cytometry by gating on the GFP+ cells (C). HPAC-GFP were orthotopically co-implanted with FB-OSM or FB-VEC into nude mice (D). BLI images at 21 days post injection and quantification of primary tumor weight at the time animals were sacrificed. A two tailed Student’s t-test was used to determine significance; ** = p ≤ 0.01. Representative BLI images, site and frequency of metastasis, and Kaplan-Meier survival curve of mice that received HPAC GFP & FB-VEC or HPAC GFP & FB-OSM cells (E).

