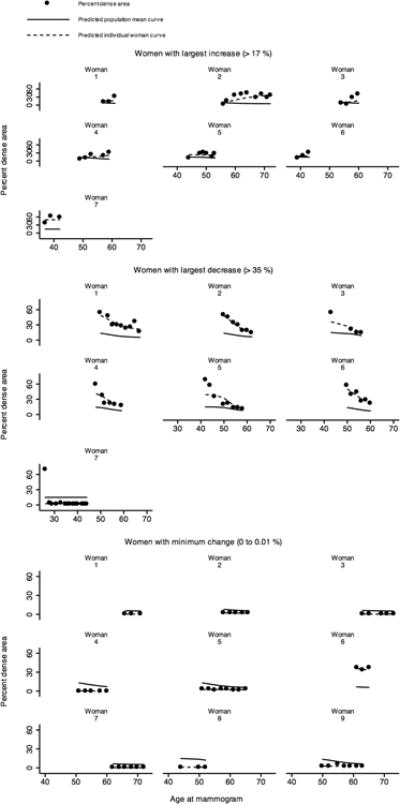
Figure 2.

Observed, predicted population mean, and predicted individual percent dense area (PDA) as a function of age at mammogram for women with the largest increase (> 17%), largest decrease (> 35 %) and minimum change (0 to 0.01 %) in PDA from the first to the last mammogram and had 3 mammograms or more in total, plotted over the range of ages at mammograms relevant for each woman
