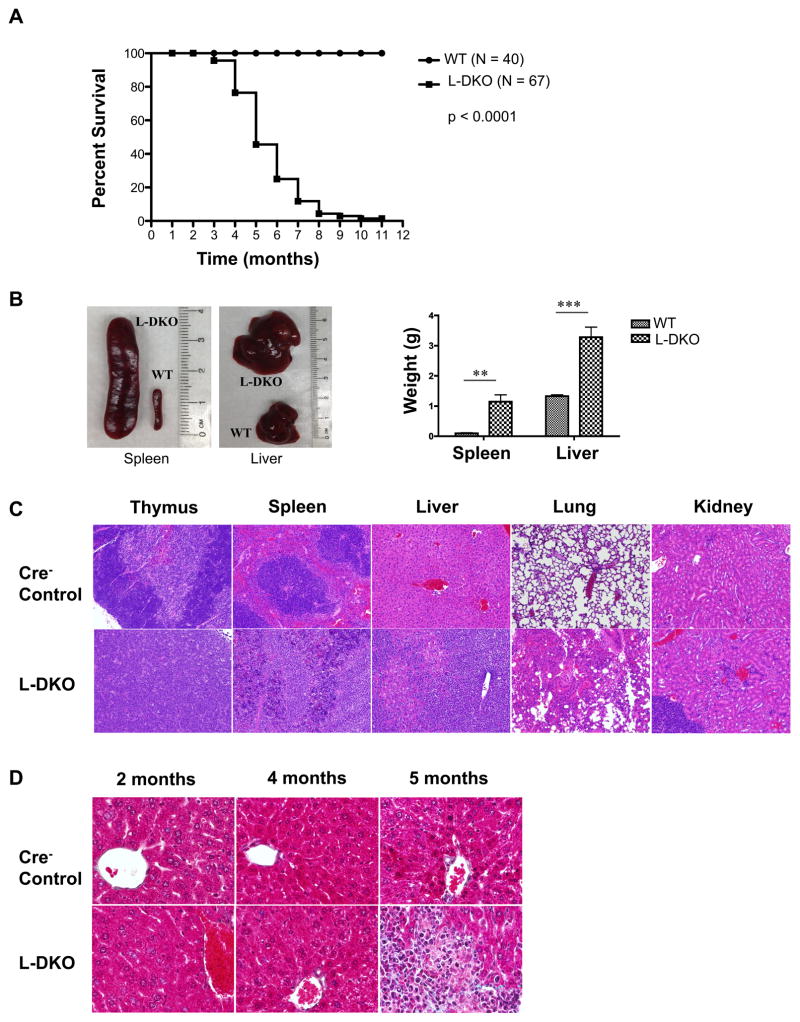
Figure 1. Deficiency of both ID2 and ID3 in developing T cells leads to lymphomagenesis in mice.
(A) Survival curve for Id2f/fId3f/fLCKCre+ (L-DKO) and control (LckCre−) mice. p value based on the Mantel-Cox test (B) Comparison of size and weight (N = 4 for WT, N = 5 for L-DKO) of spleen and liver from L-DKO and wild type control mice (C) Representative H&E staining for thymus, spleen, liver, lung and kidney from L-DKO mice and controls (100X). (D) Representative Masson’s trichrome staining for livers from L-DKO mice and controls at 2, 4 and 5 months of age (400X). N = 3 for (C) and (D).

