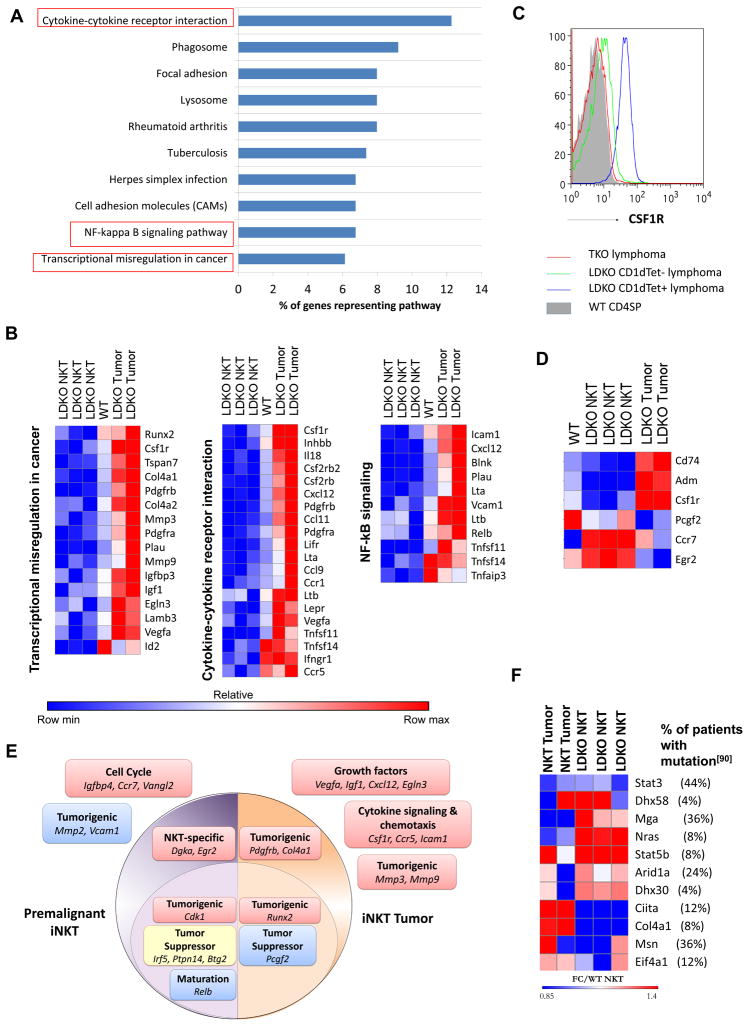
Figure 8. The concurrent loss of ID2 and ID3 turns on an oncogenic program in NKT cells.
(A) Pathways overrepresented by genes with greater than 2 fold gene expression in NKT tumor samples according to gene sets annotated by Kyoto Encyclopedia of Genes and Genomes (KEGG)[97]. Percentages represent fraction of genes from each pathway that are overexpressed in the samples. (B) Heat maps showing relative log fold change of gene expression with respect to WT DP cells for genes from pathways identified in the above analysis. (C) Representative CSF1R surface staining for CD1dTet+, CD1dTet− lymphoma samples (N=4) from L-DKO, TKO and WT control mice (N=3). (D) Heat maps showing select genes with significant differential expression among premalignant and tumor samples. (E) Graphic depicting a few key overrepresented pathways in premalignant NKT cells from 20 day old L-DKO mice (purple), or in CD1dTet+ NKT lymphoma cells from older L-DKO mice (orange). Downregulation (blue), upregulation (red) or partial upregulation and downregulation (yellow) of selected genes from the pathways is also shown. (F) Fold change in gene expression with respect to WT NKT cells, of genes that are implicated in human NKT tumors,[90] and also dysregulated in L-DKO iNKT tumors. Percentages in top panel indicate the percent of patients with NKT lymphomas (total N = 25) that have mutations in the listed genes, as characterized by Jiang et al.[90]

