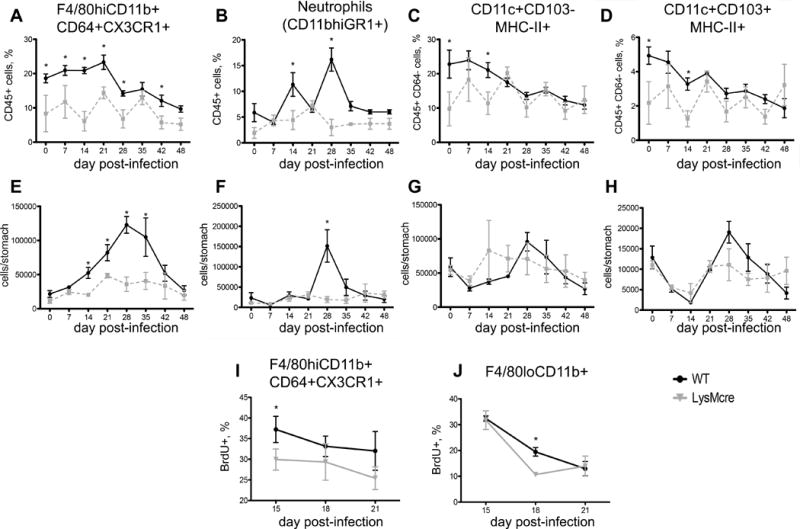
Figure 2. Helicobacter pylori infection causes accumulation of CD11b+F4/80hiCD64+CX3CR1+ macrophages in the gastric mucosa.

Time-course FACS analysis of gastric myeloid cells after H. pylori infection of WT and LysMcre mice. The analysis was performed at the indicated times in cells isolated from mouse stomachs. Plots represent percentages (top row) and absolute numbers (middle row) of CD11b+F4/80hiCD64+CX3CR1+ macrophages (A, E) neutrophils, (B, D) CD11c+CD103− (C, G) and CD11c+CD103+ DC (D, H) subsets. DC gating was done on MHCII+CD64− cells. Results are averages of 5 mice per time-point and are presented as mean ± SEM (n=5/time point). (I, J) BrdU incorporation was measured by flow cytometry in CD11b+F4/80hiCD64+CX3CR1+ and F4/80loCD11b+ cells isolated from the stomach of H. pylori infected mice on days 15, 18 and 21 post-infection. Points with an asterisk are significantly different when compared to the control group (P<0.05). Results are representative of 5 independent replicate experiments with same results. Points with an asterisk are significantly different when compared to the control (WT) group (P<0.05).
