
Fig. 2.
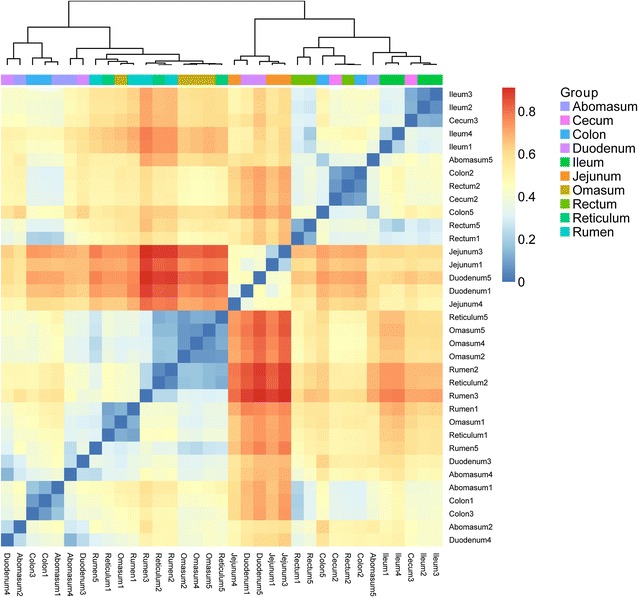
The heatmap of beta diversity of samples. The different color intensities represent the relative bacteria abundance in each sample. The number following the sample names stand for the sheep number. For example, reticulum 1, reticulum 2, reticulum 3, reticulum 4, and reticulum 5 stands for the reticulum samples from the 1st, 2nd, 3rd, 4th, and 5th sheep