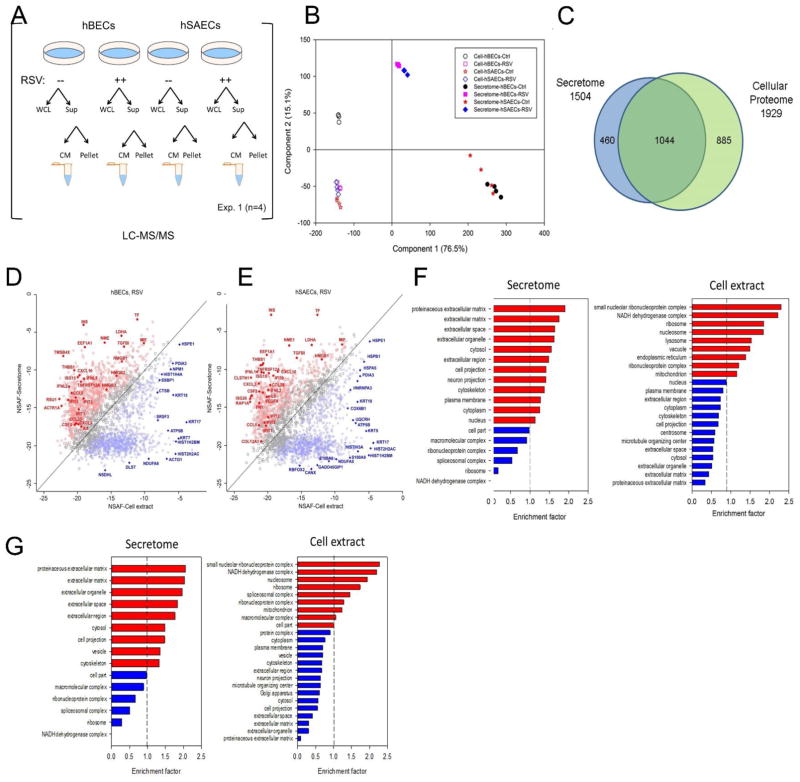
FIGURE 2.
Standardization of workflow for secretome characterization. (A). Schematic view of sample analysis by label-free LC-MS/MS. Four experiments were conducted on tert-hBECs and tert-hSAECs uninfected (control) or RSV-infected (MOI 1.0) for 24 h. Cell lysates and cell-free supernatants were isolated from each plate. Abbreviations: CM, conditioned medium; Exp, experiment; Sup, supernatant; WCL, whole-cell lysate. (B). The proteins from control- or RSV-induced secretome and whole cell lysates (WCLs) from tert-hBECs and tert-hSAECs were subjected to Principal Component Analysis (PCA). For each cell type and condition, the orthogonal transformation is applied. (C). Venn diagram showing the relationship between 1,929 WCL protein analysis vs the 1,504 proteins identified in both cell types. (D). Comparison of protein expression levels in the secretome vs that in WCLs for RSV-infected tert-hBECs. Normalized spectral abundance factor (NSAF) values of proteins identified in the tert-hBEC secretome (Y axis) were plotted vs their abundance in WCLs (X axis). Proteins in red are more enriched in the secretome (Benjamini Hochburg correct FDR <1%); proteins in blue are more enriched in WCLs. (E). Comparison of protein expression levels in the secretome vs that in WCLs for RSV-infected tert-hSAECs. NSAF values in the RSV-induced secretome (Y axis) are plotted vs their abundance in WCLs (X axis). (F). GO Cellular Component enrichment (GOCC) of the tert-hBEC secretome and WCL (cell extract). X axis, genome ontology enrichment factor. Only GO classifications with FDR <1% are shown. Red bars indicate enrichment; blue bars indicate depletion. (G). GOCC of the tert-hSAEC secretome and WCL. Data are presented as in Fig. 2F.

