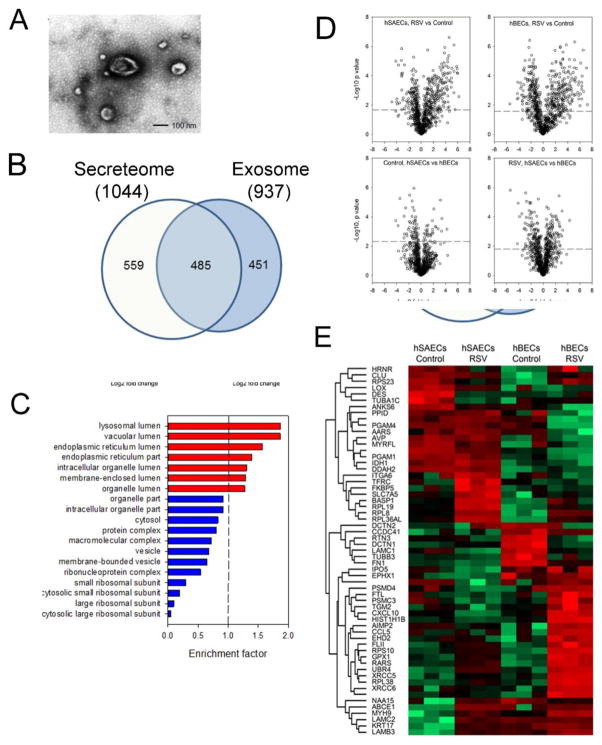
FIGURE 3.
Analysis of the exosomal fraction in the epithelial secretome. (A). Transmission electron microscopy of exosome fraction from tert-hSAECs. Note the membrane-enclosed vesicle, and characteristic “cupped” appearance. (B). Overlap of exosomal and secretome protein identifications. Venn diagram of high- confidence proteins identified in each fraction. (C). GOCC of 937 identified exosomal proteins. X axis, genome ontology enrichment factor. Only GO classifications FDR <1% are shown. Red bars indicate enrichment; blue bars indicate depletion. (D). Volcano plots of pairwise comparison. The dashed lines indicate the Student’s t-test Benjamini-Hochberg FDR 5%; the dots above the dashed lines are proteins whose abundance was significantly changed. (E). 2-Dimensional hierarchical clustering of proteins whose abundance was significantly changed (Student’s t-test Benjamini-Hochberg FDR 5%, fold change > 5-fold). Expression values of proteins were z-score-normalized data of log2-transformed expression values for biological replicates. Hierarchical clustering was performed with columns representing cell samples and rows representing individual proteins (green, low expression, red, high expression). The protein name is given for each row.

