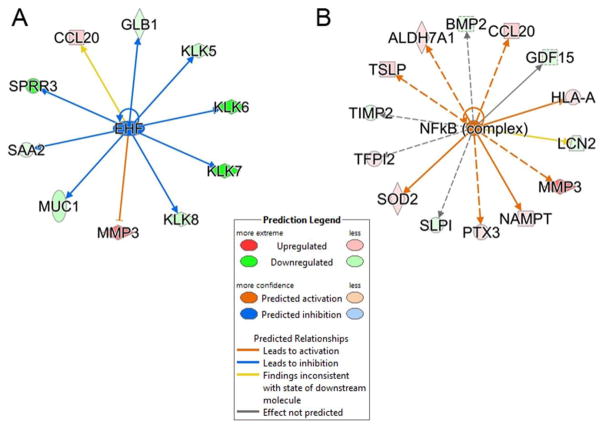
FIGURE 8.
Upstream Regulator Analysis. Upstream regulator analysis was conducted to determine transcription factors regulating the proteins in cluster 3. Shown are the overlap P-value measuring network enrichment and activation Z-score for each of two networks. (A). ETS homologous factor (EHF) network. Shown is a downregulated network (blue) with an activation Z-score of -2.53. Abbreviations: EHF, ets homologous factor; KLK, Kallikrein-like peptidase; SPRR3, small proline-rich protein 3; MUC, mucin; SAA, serum amyloid A. (B). Upregulated NFκB network. This network is activated by RSV with an activation Z score of +2.131. Abbreviations: BMP, bone morphogenic protein; MMP, matrix metalloproteinase; TIMP, metalloproteinase inhibitor; SOD, superoxide dismutase.

