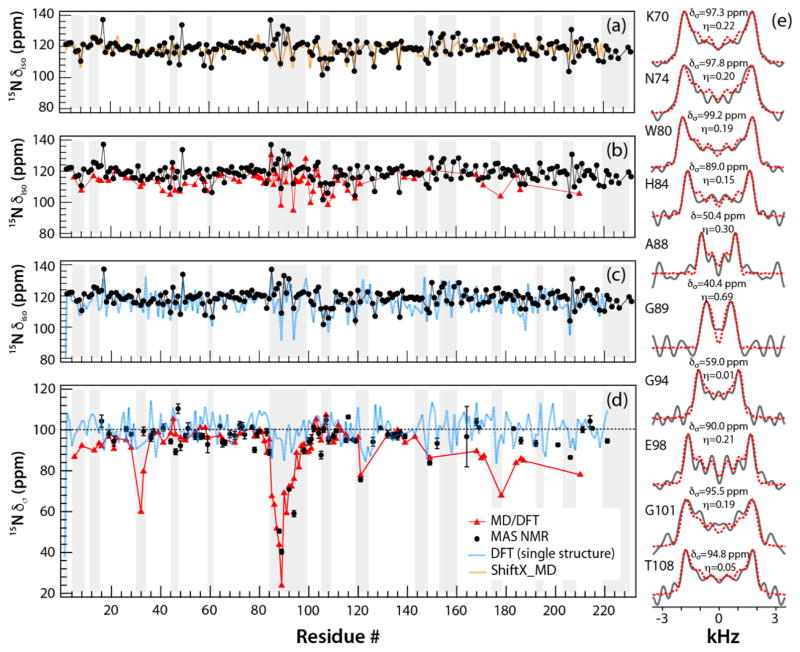
Figure 3.
The backbone 15NH chemical shift parameters in tubular assemblies of CA, plotted as a function of the residue number: δiso (a–c) and δσ (d). The parameters are shown as follows: isotropic chemical shifts or reduced chemical shift anisotropy recorded from 3D RNCSA NMR experiments, black; calculated by MD/DFT, red; calculated by DFT from a single X-ray structure, blue; calculated by ShiftX, orange. The error bars are shown on the experimental δσ values. The grey rectangles denote the loop regions of CA protein, (e) Experimental (solid black lines) and simulated (dashed red lines) 15NH RNCSA lineshapes plotted for selected CA residues; the best fit CSA parameters are indicated above each spectrum.

