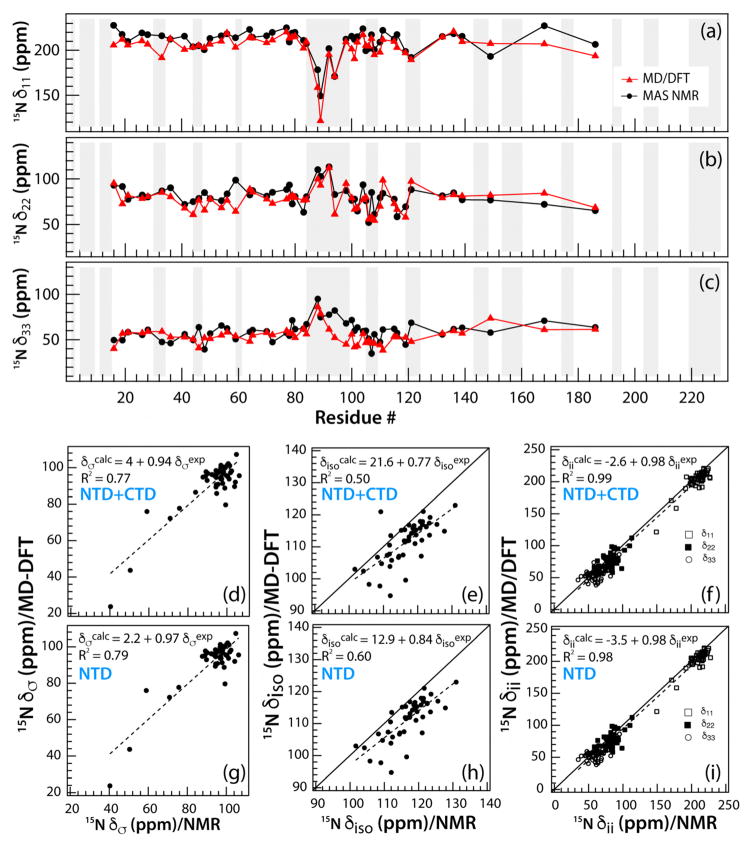
Figure 4.
(a–c) The backbone 15NH principal components of the CSA tensors, δii, in tubular assemblies of CA, plotted as a function of the residue number. The experimental values obtained from 3D RNCSA are shown in black; the values calculated by MD/DFT are in red. (d–i) The MD-DFT calculated CSA tensor parameters, δσ, δiso, and δii, plotted vs. the corresponding experimental parameters. The parameters for both NTD and CTD are displayed in (d–f); those for NTD only are shown in (g–i).

