
Fig. 5.
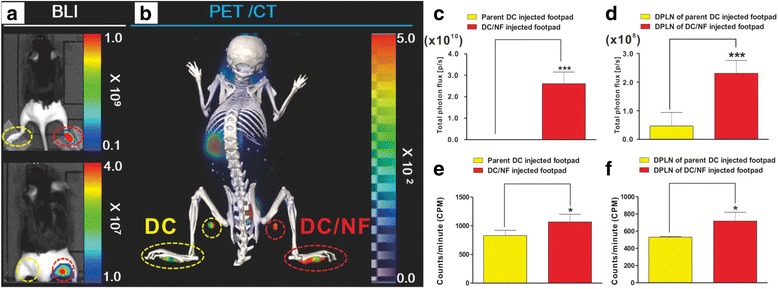
In vivo combined BLI and 18F-TFB PET/CT imaging of DC migration after their subcutaneous injection into footpads. a In vivo BLI (upper panel: without masking the footpads; lower panel: after masking the footpads) and b 18F-TFB PET/CT imaging of DC/NF cell migration to the DPLNs after their injection into mouse footpads. Quantitative analysis of c, d bioluminescence signals (P/cm2/s/sr) and e, f radioactivity (count per minute) in DC-injected footpads and DPLNs. The red and yellow circles indicate the DC and DC/NF injection sites and DPLNs, respectively. Data are expressed as mean ± SD; n = 5