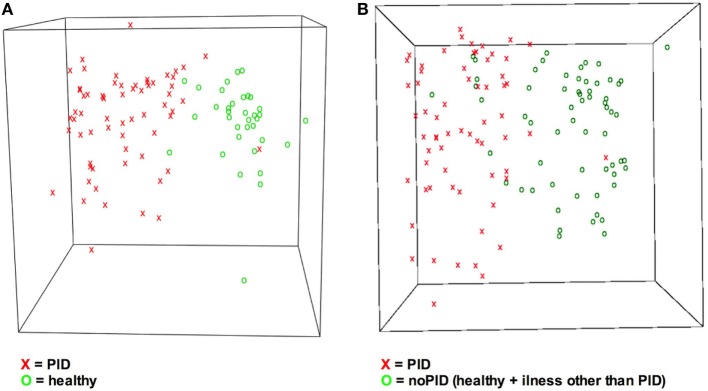
Figure 4.
Visualization of answers indicates different answer pattern. Answer pattern can be visualized by the dimension reduction technique Sammon mapping. X = primary immunodeficiency disorder (PID), O = control. (A) Classes PIDs vs. healthy are easy to distinguish. (B) Due to increased heterogeneity it is more difficult to discriminate classes PID vs. no-PID. No-PID contains questionnaires from healthy children and children suffering from illnesses other than PID.

