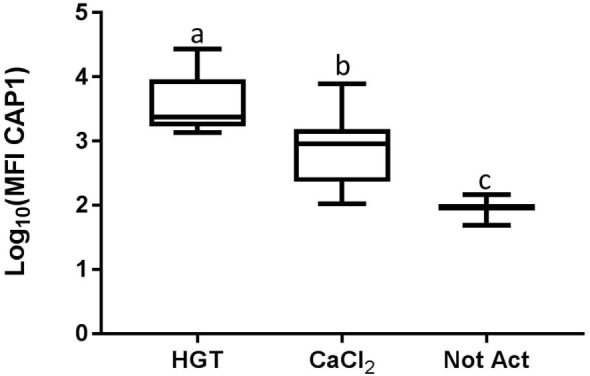
Figure 4.

Median fluorescence intensity (MFI) for CAP1. HGT, human γ-thrombin; CaCl2, calcium chloride; Not Act, not activated. The data have been log transformed to reduce skew of the data for visualization of differences among the three groups. The middle line represents the median, the ends of the box are the 25th and 75th percentiles, and the whiskers are the minimum and maximum values. Activation treatment group had a significant effect on MFI (p < 0.0001) using a repeated measures analysis and each of the treatment groups was significantly different than the other treatment groups based upon pair-wise comparison.
