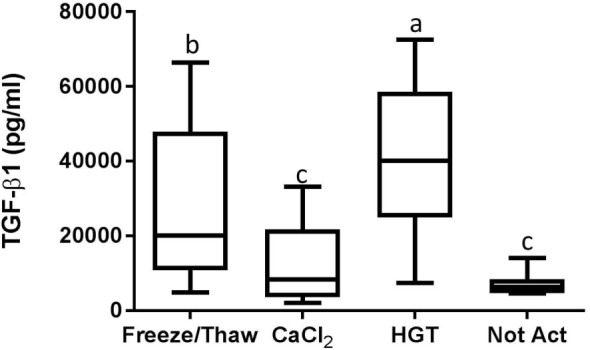
Figure 5.

Transforming growth factor-β1 (TGF-β1) concentration. HGT, human γ-thrombin; CaCl2, calcium chloride; Not Act, not activated. The middle line represents the median, the ends of the box are the 25th and 75th percentiles, and the whiskers are the minimum and maximum values. Activation treatment group had a significant effect on TGF-β1 concentration (p < 0.01). If two groups share a common letter they are not significantly different (p > 0.05).
