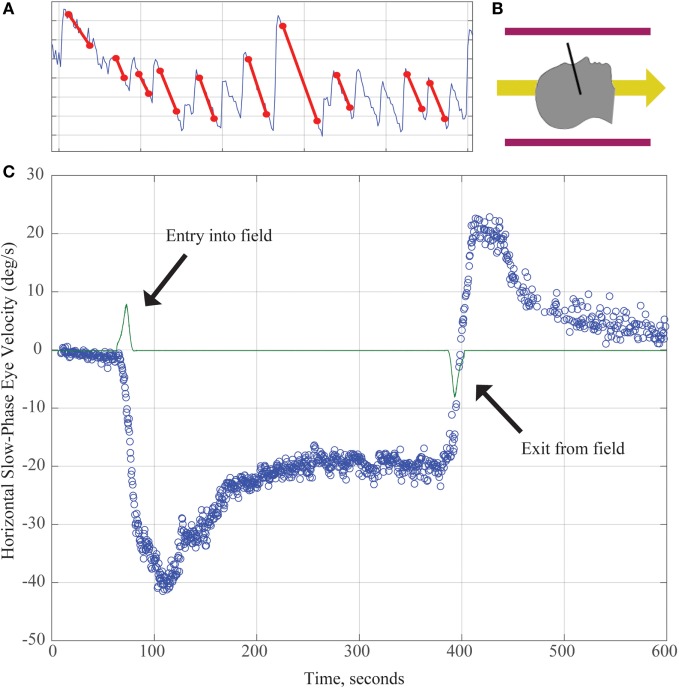
Figure 1.
(A) Horizontal position of the eye as a function of time demonstrating slow and quick phases of nystagmus over about 8 s. The slope of the slow component (marked with red lines) is used to calculate the slow-phase velocity (SPV) in panel (C). (B) Subjects enter the magnetic field head-first (magnetic field vector shown by yellow arrow). Black line demonstrates approximate location of Reid’s plane. (C) SPV versus time. The green line represents electromagnetic induction due to motion through the magnetic field gradient, with peaks marking time of entry into/exit from the magnetic field. Each blue dot represents SPV of a beat of nystagmus. SPV increases to a peak shortly after entry before partially adapting. After exiting the magnet, an aftereffect appears with nystagmus in the opposite direction. Its rate of decay reflects the dissipation of the adaptation that had taken place inside the MRI.

