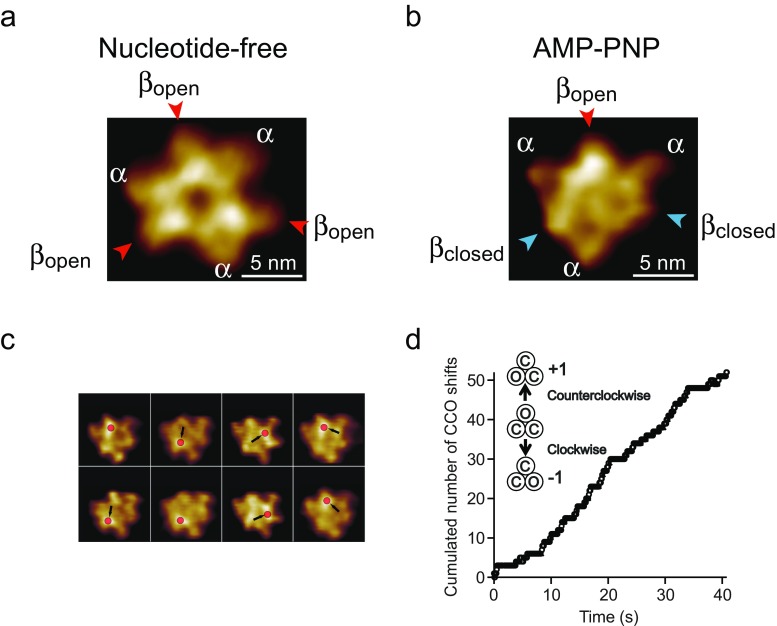
Fig. 6.
High-speed atomic force microscopy (HS-AFM) imaging of the isolated α3β3-ring. a Averaged AFM image without nucleotide when observed from the C-terminal side. The red arrows indicate β subunits showing an open conformation (Uchihashi et al. 2011). b Averaged AFM image at 1 mM AMP-PNP. The blue arrows indicate the β subunits showing a closed conformation. c Successive HS-AFM images showing conformational change of the β subunits at 2 μM ATP (left-to-right and top-to-bottom). The red circles indicate the highest pixel in each image. The frame rate of imaging is 12.5/s. d Time course of the cumulated number of counterclockwise shifts of the CCO state. The black circles, crosses, and pluses represent CCO, COO, and other irregular states, respectively

