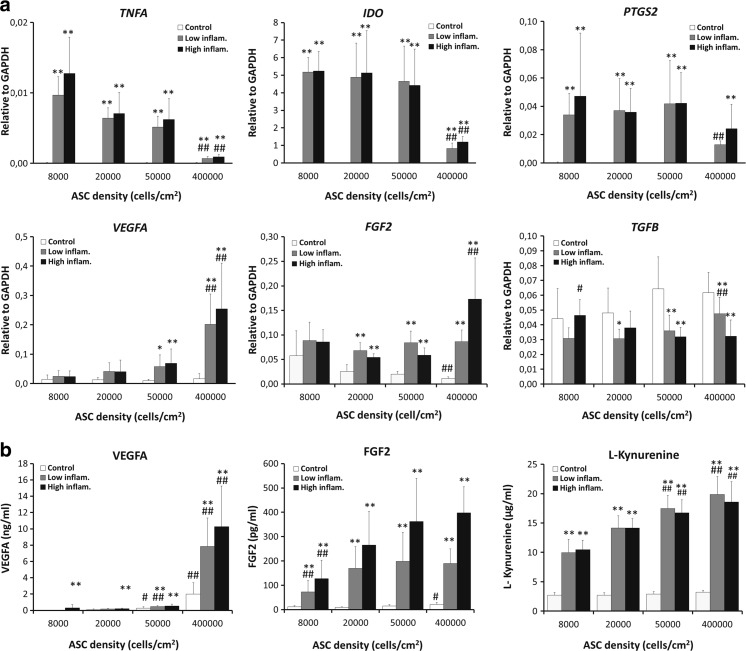
Fig. 4.
Gene expression patterns and cytokine production of ASCs seeded at different cell densities and in the presence of inflammatory cytokines- 10 ng/ml TNFα +25 ng/ml IFNγ (low inflammatory) and 20 ng/ml TNFα +50 ng/ml IFNγ (high inflammatory)- (a) TNFA, IDO, PTGS2, VEGFA, FGF2 and TGFB expression relative to GAPDH and (b) VEGFA, FGF2 and L-kynurenine production. Each bar represents mean ± SD from 3 ASCs donors in triplicate (*P < 0.05, **P < 0.01 when compared with control condition within same density, # P < 0.05, ## P < 0.01 when compared within same culture condition)

