FIGURE 7.

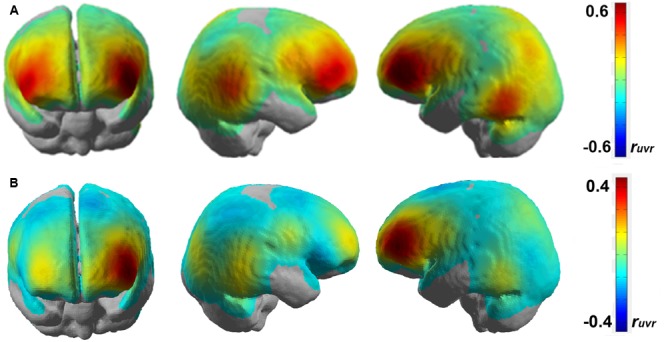
Correlation map obtained by regressing HbR for each fNIRS channel over n-back working memory load level for (A) participant 3 and (B) participant 4 on a standard brain template.

Correlation map obtained by regressing HbR for each fNIRS channel over n-back working memory load level for (A) participant 3 and (B) participant 4 on a standard brain template.