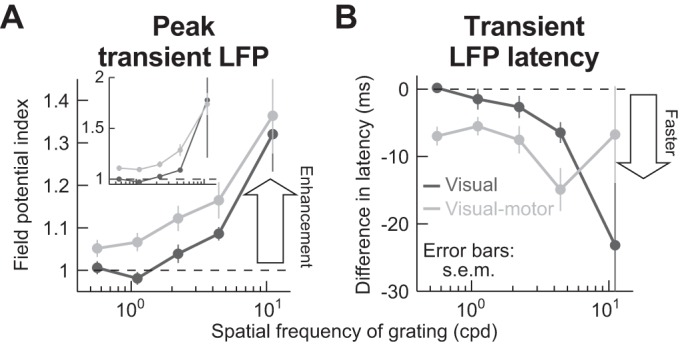
Fig. 9.

Lack of microsaccadic suppression in LFP stimulus-evoked responses. A: we performed an analysis similar to that shown in Fig. 4A, but on LFPs. We measured peak LFP response with and without microsaccades and then obtained a modulation index (see materials and methods). The inset shows the modulation index from raw measurements, whereas the main panel shows the same analysis but after a baseline shift was subtracted from the microsaccade trials. Specifically, data shown in Fig. 10 suggest that there is a negativity in LFPs after microsaccades that and stimulus onset in the microsaccade trials came after a previous microsaccade. Thus we measured the peak LFP stimulus-evoked response on microsaccade trials as the difference between the raw LFP stimulus-evoked negativity minus the baseline LFP value that was present at the time of grating onset (see materials and methods). In both the inset and the main panel, there was no suppression in the stimulus-evoked LFP response, contrary to firing rate results (Fig. 4A). Rather, there was response enhancement, which progressively increased with increasing spatial frequency, and this happened for both visual and visual motor electrode track locations (P < 0.01 for either baseline-corrected or raw measurements and for each of visual-only or visual motor electrode tracks; Kruskal-Wallis test with spatial frequency as the main factor). B: analyses similar to those in A but measuring the latency to LFP stimulus-evoked response, which decreased on microsaccade trials (y-axis values <0 ms; P < 0.02 for visual electrode tracks and P = 0.07 for visual motor electrode tracks; Kruskal-Wallis test with spatial frequency as the main factor). Thus, when a stimulus appeared immediately after a microsaccade, the stimulus-evoked LFP response started earlier than without a microsaccade. Error bars denote SE.
