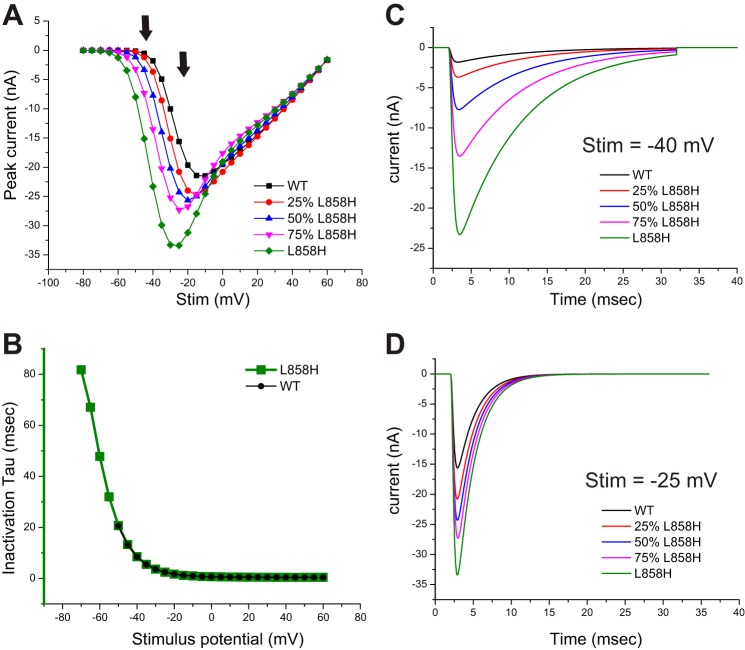
Fig. 2.
Overlay of traces from each model at selected stimulus values. This figure compares traces obtained from each model in response to selected stimulus values. A: the peak I-V curves generated from each model are plotted together to better illustrate the increased currents elicited in the stimulus range of −60 mV to −20 mV as the activation voltage dependence of each model was shifted. The arrows indicate the stimulus values chosen for sweep overlay comparisons. B: the inactivation kinetics were fitted with a single-exponential decay function, and the tau values derived from the Nav1.7-WT and Nav1.7-L858H model data are plotted. Fits were only performed on traces with at least 500 pA of peak current. C: traces computed from each model in response to a −40-mV stimulus are overlaid to illustrate that even though peak current is greatly increased, there is no difference in the inactivation kinetics for a shared stimulus potential. D: traces computed from each model in response to a −25-mV stimulus are overlaid. Again, even though there are differences in peak amplitude there is no difference in inactivation kinetics between the models.

