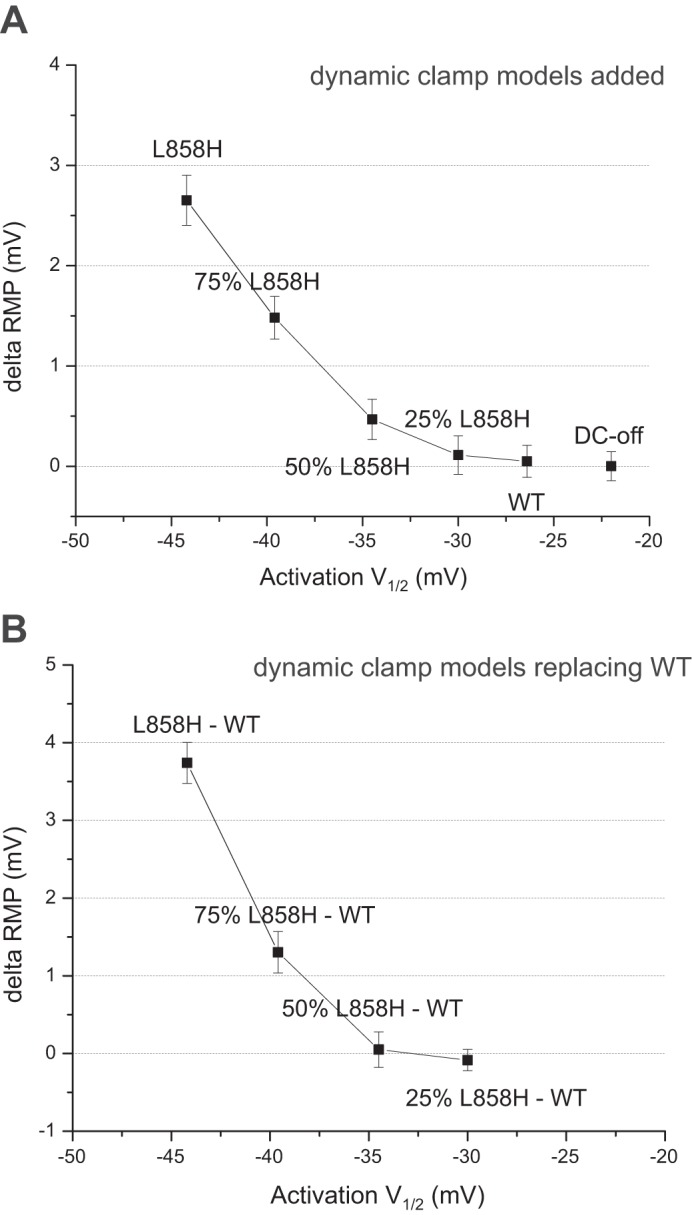
Fig. 4.

Shift of RMP observed by dynamic-clamp models. A: analysis of adding each dynamic-clamp conductance. To facilitate comparing the different dynamic-clamp models a fixed conductance was used, corresponding to an average reported conductance for small DRG neurons. The change of RMP was calculated, and the average results from many cells are plotted (n = 8–18). The average change of RMP is plotted as a function of the model’s activation V1/2, which reveals a nonlinear relationship. B: analysis of replacing the WT-Nav1.7 with mutant Nav1.7. These data were obtained by implementing two models simultaneously and specifying a negative conductance for Nav1.7-WT. As above, the data are averages from multiple cells (n = 4–8) and plotted using the mutant model’s activation V1/2. Significance was evaluated by paired t-test.
