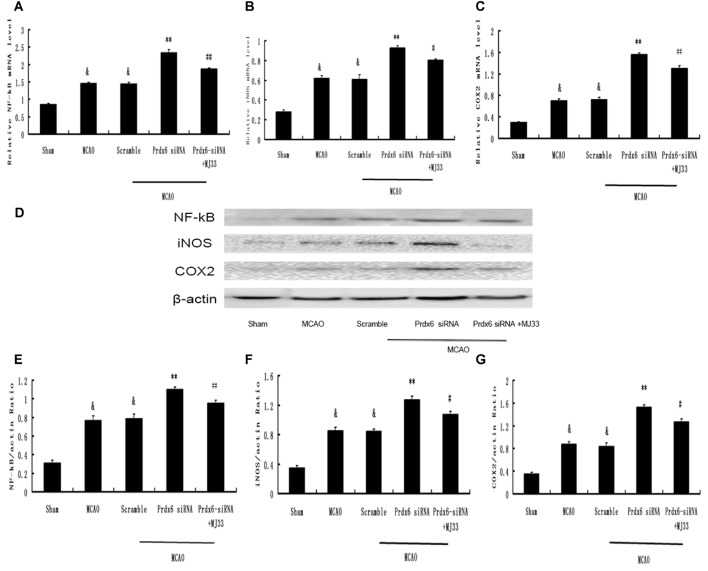
Figure 10.
Expression of NF-κB, iNOS and COX-2 in response to Prdx6 siRNA and MJ33. Real-time PCR results, representative Western blot bands, and semi-quantitative analyses of NF-κB (A,D,E), iNOS (B,D,F) and COX-2 (C,D,G) in the cortex following MCAO. Results are expressed as the mean ± SEM of three independent experiments. &p < 0.01 vs. Sham; **p < 0.01 vs. Scramble; #p < 0.05, vs. Prdx6 siRNA; ##p < 0.01 vs. Prdx6 siRNA.

