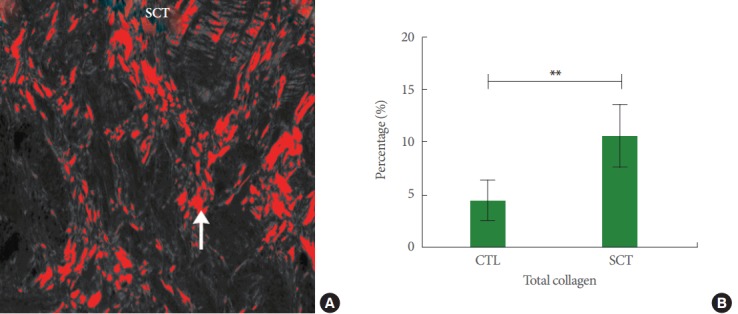
Fig. 5.

(A) Image showing the collagen amount in the extracellular matrix of the detrusor smooth muscle region of a spinal cord injury minipig (SCT). The area in red depicts the digital overlap of the detected collagen content (arrow) in a naive section. Magnification: ×14.4. (B) Total collagen in healthy reference minipigs (CTL) and SCT. A highly significant difference was observed (**P<0.0001). X-axis: groups; Y-axis: percentage of total collagen (%). Values are presented as mean±standard deviation.
