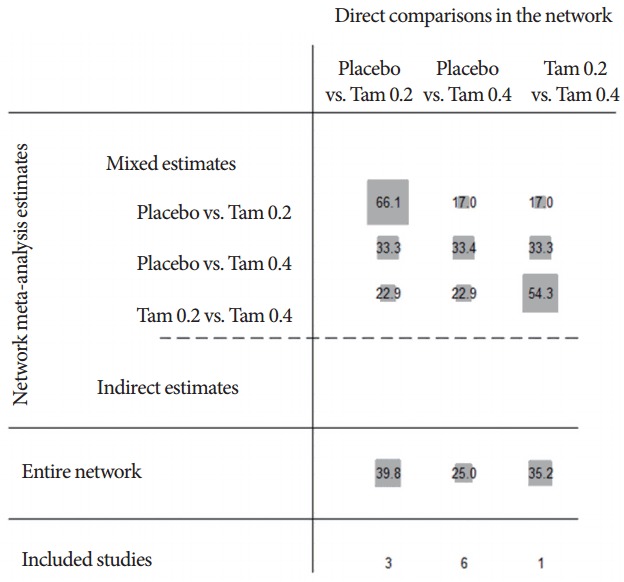
Fig. 4.

Contribution plot for mixed treatment comparison network. The size of each square is proportional to the weight attached to each direct summary effect (horizontal axis) for the estimation of each network summary effects (vertical axis). The numbers re-express the weights as percentages; Tam 0.2, tamsulosin 0.2 mg; Tam 0.4, tamsulosin 0.4 mg.
