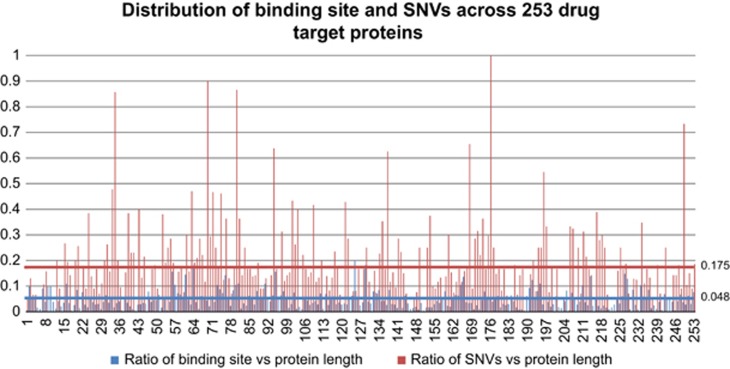
Figure 2.
Distribution of binding sites and binding sites affecting single-nucleotide variations (SNVs) across 253 drug target proteins. The blue bar indicates the ratio between number of drug binding sites and target protein length, whereas the red bar shows the ratio between number of binding sites affecting SNVs and binding sites.

