
FIG 5 .
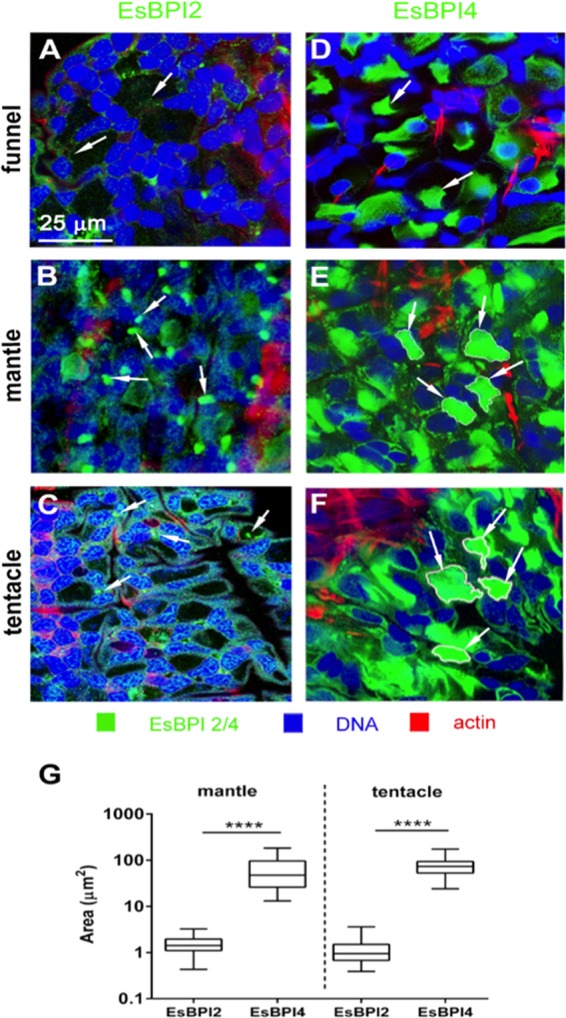
Subcellular localization of EsBPI2 and EsBPI4 by ICC. (See the legend to Fig. 4 for ICC methods.) (A to C) Typical punctate cytosolic ICC labeling of EsBPI2 (white arrows); (D to F) large stores of EsBPI4 in the cytosol (white arrows). (G) Size of labeled areas within cells. The area of cytosolic ICC labeling of EsBPI2 and EsBPI4 was determined by examining 30 regions in each tissue for three different animals. Values that are significantly different (P < 0.0001) are indicated by a bar and four asterisks.