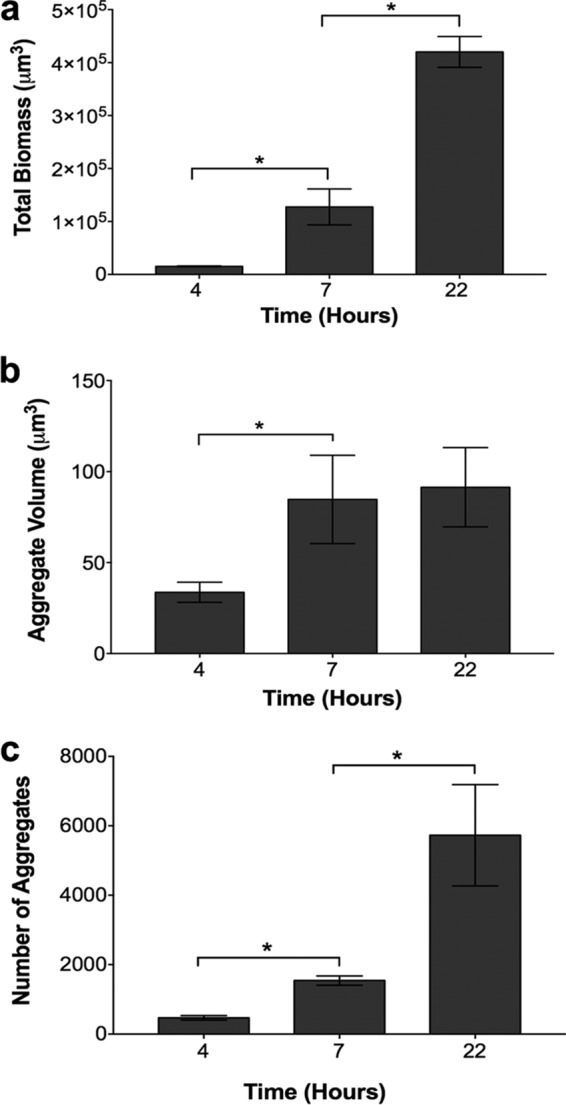
FIG 2 .

P. aeruginosa growth in SCFM2 occurs via aggregate expansion and the formation of new aggregates. (a) Growth of P. aeruginosa in SCFM2 determined by quantification of the total biomass. The biomass of P. aeruginosa expressing mCherry was quantified as the number of red fluorescent voxels. A heterogeneity test was significant by ANOVA (F2,9 = 104.5, P = 0.0001). An asterisk denotes a statistically significant difference by two-tailed t test for comparison of 4- and 7-h data [t(6) = 3.298, P = 0.0457] and comparison of 7- and 22-h data [t(6) = 6.533, P = 0.0007]. (b) Average P. aeruginosa aggregate volume in SCFM2. To measure the average P. aeruginosa aggregate volume in SCFM2, the total volume of red fluorescent voxels within an aggregate was quantified. These measurements differ from those in Fig. 1c, as the high-resolution 3D images used in this analysis allow the precise quantification of cells without the assumption that aggregates are entirely filled with cells. A heterogeneity test was marginally significant by ANOVA (F2,9 = 4.139, P = 0.0531). An asterisk denotes a statistically significant difference by two-tailed t test [t(6) = 2.568, P = 0.04]. (c) Total number of P. aeruginosa aggregates in SCFM2. Aggregates were defined as cell clusters of >5.0 µm3, and all of the aggregates within each image with dimensions of 135 by 135 by 60 µm were counted. A heterogeneity test was significant by ANOVA (F2,9 = 10.75, P = 0.0041). An asterisk denotes a statistically significant difference by two-tailed t test for comparison of 4- and 7-h data [t(6) = 7.261, P = 0.0014] and comparison of 7- and 22-h data [t(6) = 2.854, P = 0.0290]. The bars in all of the panels represent the average ± the standard error of the mean of four replicates.
